
Support and Resistance Breakouts
JustWolves is an educational platform and is not a SEBI-registered investment advisor. Trading financial instruments involves significant risk of loss and may not be suitable for all investors. Past performance is not indicative of future results. Read our full disclaimer →
What you'll learn
- Horizontal levels with several clear touches make the most reliable breakout candidates
- Treat levels as zones, and define a break as a close beyond the zone, not a tick through it
- After a breakout, old resistance often becomes support (and old support becomes resistance)
- Approaches that compress into the level, with higher lows under resistance, tend to break more cleanly
- Stops go back inside the zone; targets come from the next level or a measured move
In this article · 15 sections
The simplest breakout is price closing beyond a horizontal level that has turned it back several times. Because so many traders watch the same obvious levels, these breakouts can move sharply, and they can also fail sharply. This lesson covers how to judge a level before it breaks, what counts as a genuine break, how old resistance becomes new support, and how to place entries, stops and targets.
What You Will Learn
- How to rate a level before a breakout
- What counts as a break
- Role reversal after the break
- Entries, stops and targets
Before You Start
Rating the Level
| Feature | Stronger | Weaker |
|---|---|---|
| Touches | Three or more clear reactions | One or two |
| Timeframe | Visible on the weekly and daily charts | Only on intraday charts |
| Age | Held for weeks or months | Formed in the last few sessions |
| Clarity | Tight cluster of highs | Scattered highs over a wide band |
| Approach | Higher lows pressing into it | Wide swings towards it |
A level that is obvious on a weekly chart is watched by more traders, so a break of it is more significant. A level you need to squint to see is unlikely to produce a strong reaction when it breaks.
Levels Are Zones
Highs rarely stop at exactly the same price. One may turn at ₹1,248, another at ₹1,252, another at ₹1,255. It's more realistic to mark a resistance zone from ₹1,248 to ₹1,255 than a single line.
A break then means a close above the top of the zone, not a trade at ₹1,250. Defining it this way removes many of the intraday pokes that quickly reverse.
Role Reversal
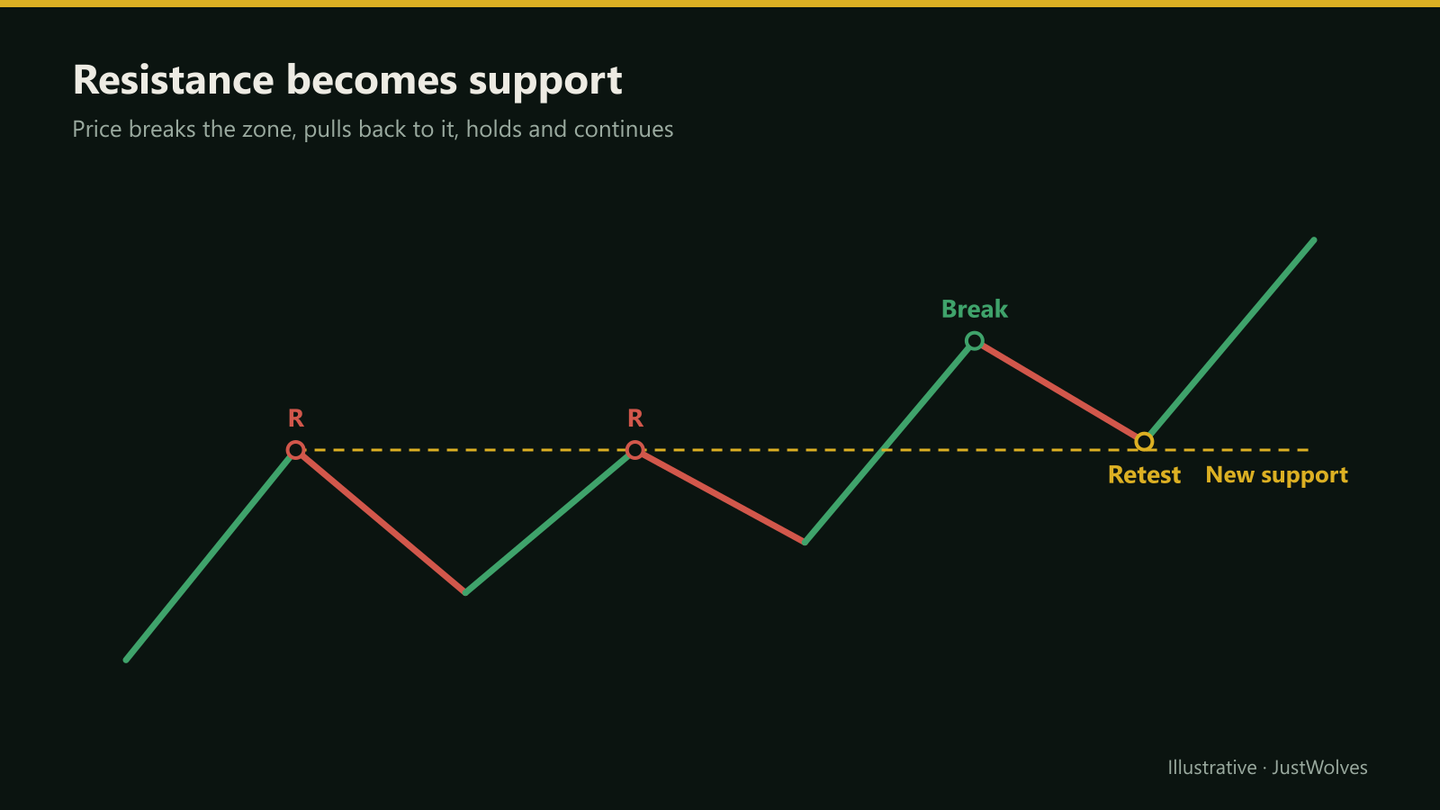
Once resistance breaks, the traders who sold there may want out near their entry, and those who missed the breakout may want to buy a dip. That combination often makes the old resistance zone act as support on the first pullback, a pattern called role reversal or polarity.
This gives breakout traders a second entry: buying the retest of the broken level. Breakout and Retest covers it in detail.
Real Prices: Zone, Break and Retest
Pooja's example in this lesson waits for the retest of a well-tested zone. The chart below shows the same sequence on real Reliance prices from August to November 2025: a resistance zone with rising lows beneath it, a breakout on volume, a retest of the old zone, and the measured move.
Real prices: a resistance zone, a breakout on volume and a retest, Reliance, August–November 2025
Step 1 of 4
Rating the level
From August to mid-October 2025 Reliance is capped in a zone from about ₹1,416 to ₹1,432 (highs of ₹1,431.9 on 21 August, ₹1,422 on 18 September and ₹1,423 on 17 October), while its lows rise from ₹1,340.6 on 1 September to about ₹1,357–1,368 in October.
- What to observe
- A zone, several tests and higher lows: the stronger column of this lesson's table.
- Condition
- A break means a close above the top of the zone.
Entries
| Entry | Advantage | Drawback |
|---|---|---|
| On the breakout close | Catches every follow-through move | Furthest from the level; enters some failures |
| Break of the breakout candle's high | Requires one more push | Slightly worse price |
| Retest of the level | Closer stop, better reward-to-risk | Strong breakouts often don't retest |
Stops and Targets
The stop goes back inside the range: a close well below the broken zone means the breakout has failed. Many traders use the low of the breakout candle or a point a little below the zone, adjusted for the stock's daily ATR.
For targets, look first for the next resistance on the weekly chart. If there isn't one nearby, a measured move projects the height of the range above the breakout level. Many traders take partial profit at the first target and trail the rest.
Practical Example
Hypothetically, a stock has a resistance zone at ₹1,248–1,255, tested four times over four months, with higher lows at ₹1,140, ₹1,175 and ₹1,205. It closes at ₹1,268 on strong volume.
Pooja waits for a retest. Three days later, the stock dips to ₹1,257, just above the zone, and forms a bullish candle. She buys at ₹1,262 with a stop at ₹1,238, below the zone, risking ₹24 a share. The range from ₹1,140 to ₹1,255 is ₹115, so her measured-move target is about ₹1,370, about 4.5R. She plans to take half at the next weekly level, ₹1,320 (about 2.4R).
Retests and Level Strength: Our Test
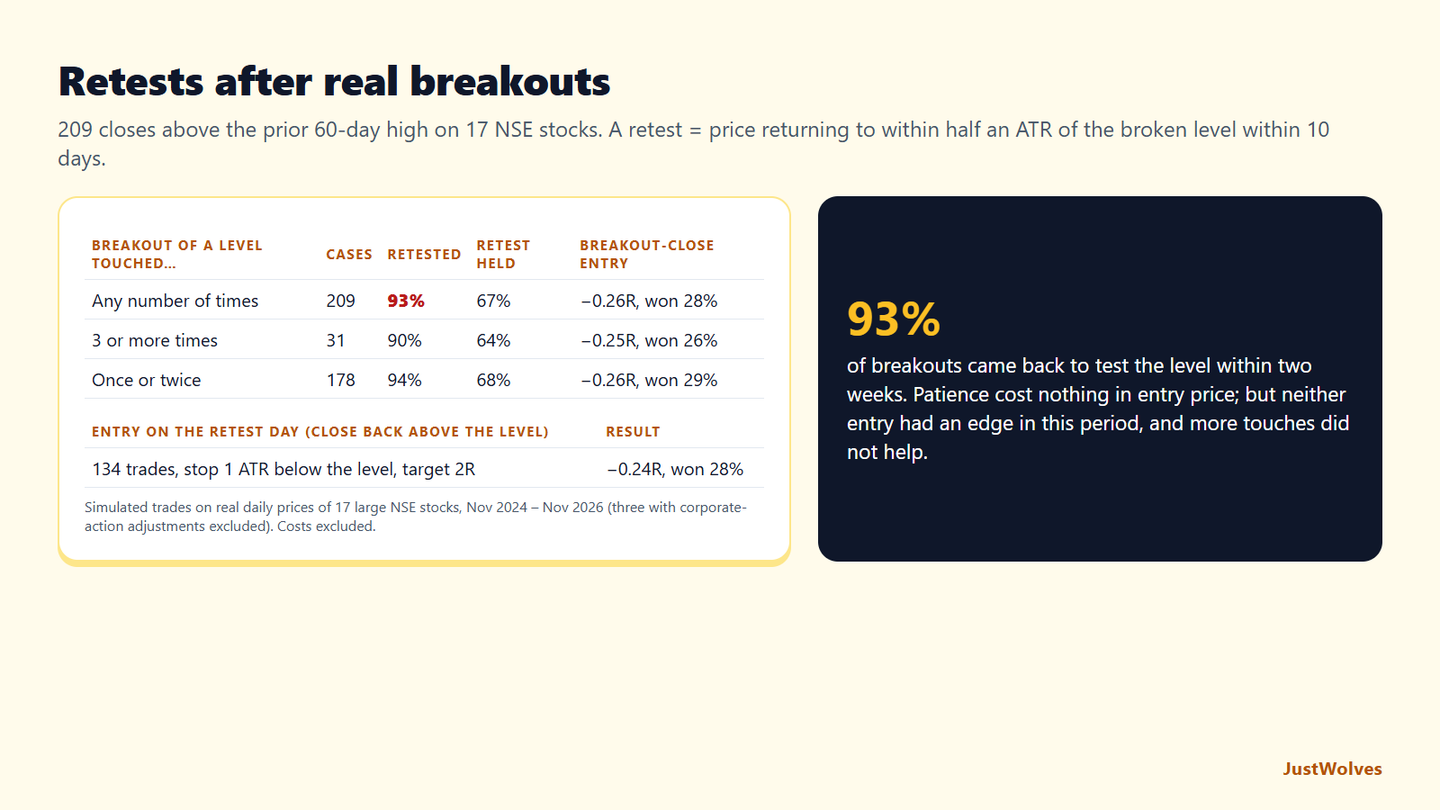
JustWolves tested this lesson's ideas on about two years of daily prices for 17 large NSE stocks (November 2024 to November 2026): 209 closes above the highest high of the previous 60 trading days. For each, we counted how many separate times the level had been touched, within 1%, in those 60 days; checked whether price came back to within half an ATR of the level within 10 days (a retest), and whether the retest held; and compared two entries with the same stop, one ATR below the level, and a 2R target: at the breakout close, and on the retest day if it closed back above the level.
| Level touched… | Cases | Retested within 10 days | Retest held | Breakout-close entry |
|---|---|---|---|---|
| Any number of times | 209 | 93% | 67% | −0.26R, won 28% |
| 3 or more times | 31 | 90% | 64% | −0.25R, won 26% |
| Once or twice | 178 | 94% | 68% | −0.26R, won 29% |
| Entry | Trades | Average | Won |
|---|---|---|---|
| Retest day, closing back above the level | 134 | −0.24R | 28% |
Retests were the norm, not a bonus. Ninety-three percent of breakouts came back to the level within two weeks, and about two-thirds of those retests held. That makes this lesson's second entry, buying the retest, available almost every time, usually at a better price than the breakout close, so there was little reason to chase.
But neither entry had an edge in this period. Breakout-close and retest entries both lost about a quarter of R per trade on average and won only about 28% of the time with a 2R target. This matches the previous lesson's finding that most breakouts in these two years failed to follow through.
More touches did not help here. Levels touched three or more times broke out no more successfully than levels touched once or twice, against the idea in this lesson's rating table. With 31 cases, the sample is small, and our rule counts touches mechanically rather than judging the quality of a level as a trader would. What the data supports clearly is the professional habit in this lesson: be very selective, and treat the retest and a stop below the zone as standard parts of the plan.
Common Mistakes
- Treating a level as an exact price.
- Entering on an intraday poke instead of a close.
- Trading levels visible only on small timeframes.
- Ignoring nearby higher-timeframe resistance.
- Stops right at the level, where retests often probe.
Professional Insight
Many experienced traders find that the best support and resistance breakouts come after the level has been tested several times with steadily higher lows underneath. Each test absorbs supply at the level, and the higher lows show buyers becoming more willing to pay up. When the level finally breaks, there's less supply left to stop it.
Risk Considerations
- Retests can fail and become false breakouts.
- Gaps over the level can force worse entries.
- Obvious levels attract stop runs in both directions.
Important Terminology
| Term | Meaning |
|---|---|
| Resistance zone | A price band where rallies have repeatedly stalled. |
| Role reversal | Old resistance acting as support after a break, or the reverse. |
| Retest | A return to a broken level. |
| Measured move | The range height added to the breakout level. |
| Higher lows | Rising swing lows beneath resistance. |
How do I trade a resistance breakout?
Wait for a close above the resistance zone, then enter on the close, a break of the breakout candle's high, or a retest, with a stop back inside the range.
What is role reversal?
When old resistance acts as support after a breakout, or old support acts as resistance after a breakdown.
How many touches make a strong level?
Three or more clear reactions is a common guideline.
Should I wait for a retest?
It gives a better price and closer stop, but strong breakouts often don't retest. Choose one approach and use it consistently.
How do I set a breakout target?
Use the next higher-timeframe resistance, or a measured move equal to the range height.
How often do breakouts retest the broken level?
Very often. In our test of 209 breakouts above 60-day highs on 17 NSE stocks, 93% came back to within half an ATR of the broken level within 10 trading days, and about two-thirds of those retests held above it.
Is a level with more touches a better breakout?
Not in our data. Breakouts of levels touched three or more times in the prior 60 days did no better than those touched once or twice. The sample was small, so judge level quality on the chart rather than by counting touches alone.
Practical Exercise
Rate levels.
Your task
Step 1: Find ten resistance levels
On weekly and daily charts.
Step 2: Score them
Using the table: touches, timeframe, age, clarity, approach.
Step 3: Check past breaks
Did higher-scoring levels produce better breakouts?
Step 4: Note retests
How often did price retest the zone?
Check Your Understanding
A strong level usually has:
Related Lessons
Previous: What Is Breakout Trading?. Next: Trendline Breakouts. See also How to Draw Support and Resistance Levels Correctly.