
Opening Range Breakout (ORB)
JustWolves is an educational platform and is not a SEBI-registered investment advisor. Trading financial instruments involves significant risk of loss and may not be suitable for all investors. Past performance is not indicative of future results. Read our full disclaimer →
What you'll learn
- The opening range is the high and low of the first minutes after 9:15 am IST, commonly 5, 15 or 30 minutes
- A long entry triggers above the range high, a short entry below the range low, with the stop on the other side or at the midpoint
- Narrow opening ranges after quiet days tend to give cleaner breakouts than very wide ones
- Many ORB breaks fail, so filters, a time cut-off and a daily loss limit are essential
- Costs and slippage matter more in intraday trading; include them in every calculation
In this article · 14 sections
The first minutes of the trading session absorb overnight news, global cues and pending orders. The high and low set in that period, the opening range, often act as reference points for the rest of the day. The opening range breakout (ORB) trades a move beyond them. It's one of the most widely used intraday breakout methods in Indian index futures and liquid stocks, and one of the most frequently misused. This lesson covers how to define the range, enter, place stops and filter out poor days.
What You Will Learn
- How to define the opening range
- Entries, stops and targets for ORB trades
- Filters that improve ORB setups
- Costs, risk limits and common failures
Before You Start
Read Momentum Breakouts and Reading the Breakout Candle. This lesson discusses intraday trading in index futures; the Futures & Options course explains how futures work.
Defining the Opening Range
NSE's equity and F&O markets open for continuous trading at 9:15 am IST, after the cash market's 9:00–9:15 pre-open session. The opening range is the high and low from 9:15 to a chosen cut-off.
Common choices are 5 minutes (9:15–9:20), 15 minutes (9:15–9:30) and 30 minutes (9:15–9:45). Shorter ranges trigger earlier and more often, including more false breaks; longer ranges trigger later and less often, with wider stops. Pick one and test it, rather than switching between them.
| Range | Triggers | Stops | Typical trade-off |
|---|---|---|---|
| 5 minutes | Earliest, most often | Tightest | More false breaks |
| 15 minutes | Moderate | Moderate | Common middle ground |
| 30 minutes | Later, less often | Widest | Fewer, more developed moves |
Entries, Stops and Targets
A basic 15-minute ORB (long side)
Step 1: Mark the range
High and low from 9:15 to 9:30.
Step 2: Entry
A 5-minute close above the range high, or a buy-stop a few points above it.
Step 3: Stop
Below the range low, or below the range midpoint for a tighter stop.
Step 4: Target
A multiple of the range height, the previous day's high, or a trailing stop.
Step 5: Time cut-off
No new entries after a set time, and exit by a set time before the close.
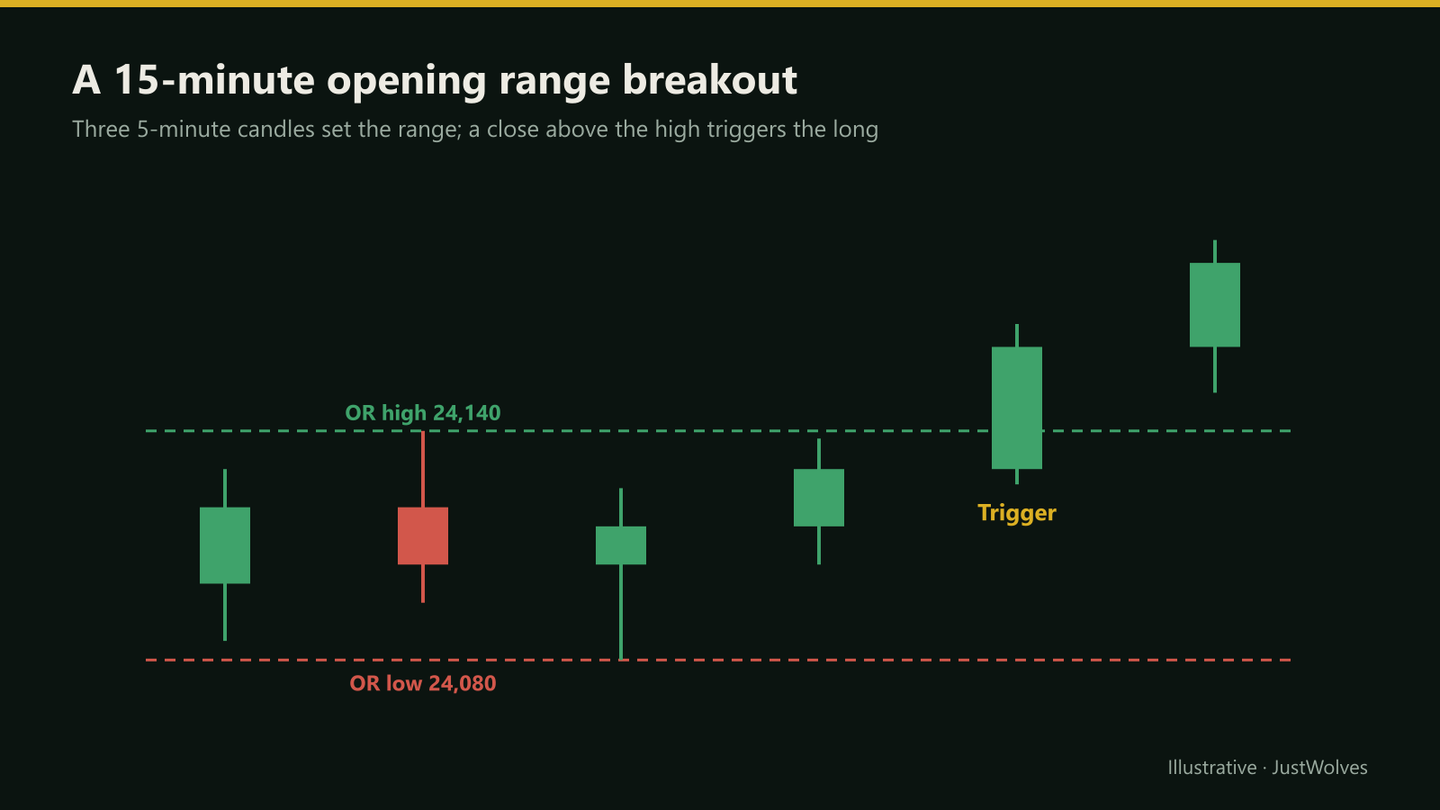
Real Prices: A 15-Minute ORB on NIFTY 50
The chart above uses hypothetical prices. The chart below shows a real 15-minute opening range breakout on NIFTY 50 on 29 October 2026, with the rules from this lesson: a close beyond the range, a midpoint stop, a 2R target and costs included.
Real prices: a 15-minute opening range breakout, NIFTY 50, 29 October 2026
Step 1 of 4
The opening range
NIFTY 50 opens nearly flat on 29 October 2026. The first 15 minutes, 9:15 to 9:30, set a range from 22,656.8 to 22,745.7: about 89 points, under 30% of the average daily range of the previous 10 sessions (about 314 points). The previous close sat just above the 20-day average.
- What to observe
- A narrow range, with the daily trend slightly up.
- Condition
- Rule: trade the first 15-minute close beyond the range.
Filters That Help
- Range width: compare the opening range with the average daily range. Very wide opening ranges leave less room and need wide stops; narrow ones after a quiet previous day often break more cleanly.
- Gap context: a large gap that holds its opening range in the gap's direction is a stronger signal than a break against the gap.
- Higher timeframe: breaks in the direction of the daily trend, or through the previous day's high or low, tend to carry more weight.
- Volume: a breakout candle with volume above the same time on recent days.
- Event days: RBI policy, budget, major data and weekly expiry can produce erratic ranges; many traders reduce size or stand aside.
Costs and Risk Limits
Intraday traders pay brokerage, exchange charges, GST, stamp duty and securities transaction tax on every trade, plus slippage. On index futures, STT is charged on the sell side; on options, it's charged on the premium. Rates change, so check your broker's current charge sheet and include total costs in every backtest and trade calculation.
Because ORB signals come every day, overtrading is a real risk. Common rules: one or two ORB trades a day at most, a fixed daily loss limit, and no re-entry after a stop-out on the same side.
Practical Example
Hypothetically, Nifty futures set a 15-minute opening range of 24,080 to 24,140 (60 points) on a day when the previous day's high is 24,260. At 9:40, a 5-minute candle closes at 24,162 on above-average volume. Vivek buys one lot (65 units) at 24,165, with a stop at 24,108, just below the range midpoint, risking 57 points, about ₹3,705 before costs.
His target is the previous day's high at 24,260, 95 points away, about 1.7R. His time cut-off is 2:30 pm. Price reaches 24,258 by 11:15 and he exits at 24,255, a gain of 90 points, about ₹5,850 before costs. At discount-broker rates, brokerage, STT, exchange charges, GST and stamp duty come to about ₹940 for the round trip (most of it STT on the sell side), leaving about ₹4,910. That is roughly 14.5 Nifty points of cost on every one-lot futures trade, win or lose.
Does the ORB Work on NIFTY? Our Test
JustWolves tested this lesson's rules on NIFTY 50 index prices, used as a guide to NIFTY futures. The main test uses hourly candles from November 2023 to November 2026, with the first hour (9:15 to 10:15) as the opening range: 705 sessions. A shorter test uses 15-minute candles for the 59 sessions from August to November 2026, with 15-minute and 30-minute ranges. Rules: enter on the first close beyond the range before 2:15 pm (hourly) or 2:30 pm (15-minute); stop at the range midpoint or the other side; exit at 2R or at the last candle of the day. Costs: 14.5 index points a round trip, the one-lot futures estimate from this lesson's example. When a stop and target fell in the same candle, we counted the stop.
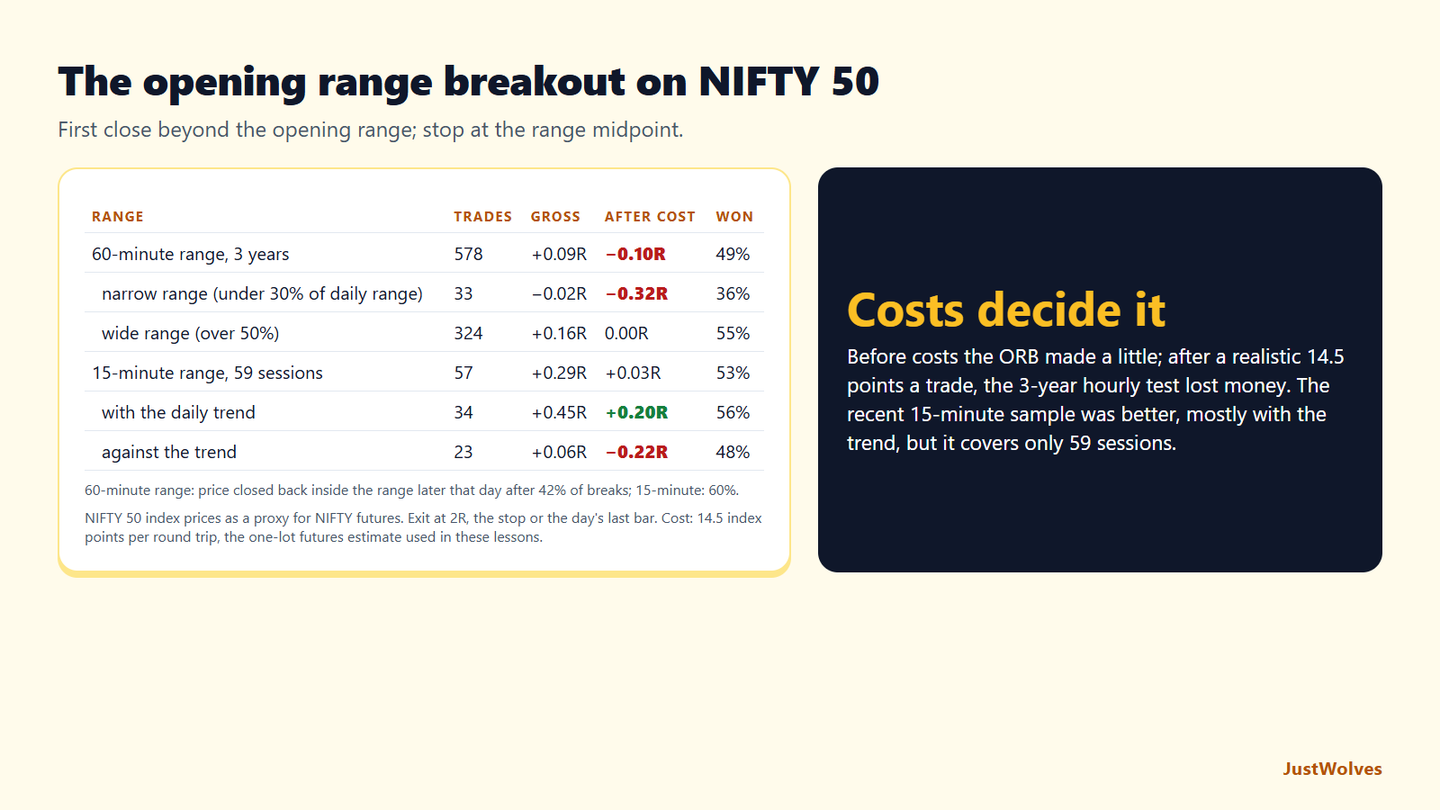
| Range and filter | Trades | Gross | After costs | Won |
|---|---|---|---|---|
| 60-minute range, stop at the other side (3 years) | 578 | +0.03R | −0.08R | 51% |
| 60-minute range, stop at the midpoint | 578 | +0.09R | −0.10R | 49% |
| narrow range (under 30% of the daily range) | 33 | −0.02R | −0.32R | 36% |
| wide range (over 50%) | 324 | +0.16R | 0.00R | 55% |
| break against the gap (gap over 0.3%) | 100 | +0.13R | −0.04R | 47% |
| break in the gap direction | 112 | +0.04R | −0.13R | 50% |
| 15-minute range, midpoint stop (59 sessions) | 57 | +0.29R | +0.03R | 53% |
| with the daily trend | 34 | +0.45R | +0.20R | 56% |
| against the daily trend | 23 | +0.06R | −0.22R | 48% |
Before costs there was a small edge; after costs, mostly none. Over three years, the hourly ORB with a midpoint stop made +0.09R per trade before costs and lost about −0.10R after them. The midpoint stop is closer, so costs take a bigger share of each R. This is the point of this lesson's warning box: the ORB is a method, not an edge in itself.
Range width worked the other way in the hourly test. Narrow first-hour ranges were few and did worst after costs, because a small stop made the 14.5-point cost a large fraction of the risk, and they were stopped out more often. Wide ranges did better before costs. In the short 15-minute sample, narrow ranges did well, as in the chart above, but there were only eight of them. Treat the "narrow range is cleaner" idea as unproven.
Breaks often failed. In the hourly test, price closed back inside the opening range later in the day after 42% of breaks; with the 15-minute range, after 60%. Both sides of the 15-minute range traded on 44% of days.
The trend filter showed promise in the recent sample. 15-minute breaks in the direction of the daily trend made +0.20R after costs; breaks against it lost. But 59 sessions is too short to rely on, and in the three-year hourly test the trend filter made no difference. Before trading an ORB, test your own range, filters and costs on a long sample, as this lesson advises.
Common Mistakes
- Trading every break, including against strong gaps.
- Very wide ranges with stops that are too far.
- No time cut-off, holding failed trades into the afternoon.
- Ignoring costs in results.
- Re-entering repeatedly after stop-outs.
Professional Insight
Experienced intraday traders who use the ORB tend to treat the opening range as information rather than a signal. A narrow range after a quiet day, breaking in the direction of the gap and the daily trend, is a setup; a wide, choppy range on an event day is a reason to wait. Filtering out most days is often what makes the method workable.
Risk Considerations
- False breaks of the opening range are frequent.
- Leverage in futures magnifies losses.
- Event days produce erratic moves and slippage.
Important Terminology
| Term | Meaning |
|---|---|
| Opening range (OR) | The high and low of the first minutes of the session. |
| ORB | A trade on a break of the opening range. |
| Range midpoint | Halfway between the OR high and low. |
| Time cut-off | A time after which no new trades are taken. |
| Slippage | The difference between expected and actual fill price. |
What is the opening range breakout strategy?
Marking the high and low of the first minutes after the open and trading a break beyond them.
What is the best opening range time in India?
Common choices are 5, 15 and 30 minutes from 9:15 am. None is best for everyone; test one consistently.
Where should the stop go in an ORB trade?
Below the range low for longs, or below the midpoint for a tighter stop.
Does the ORB work on options?
Some traders use the index's opening range to time option trades, but option prices also depend on time decay and volatility, which changes the risk.
How many ORB trades should I take a day?
Many traders limit themselves to one or two, with a daily loss limit.
Is the opening range breakout profitable on NIFTY?
Not reliably in our test. Over three years of NIFTY 50 hourly prices, a first-hour ORB made +0.09R per trade before costs and about −0.10R after a 14.5-point round-trip cost. A 59-session 15-minute test was slightly positive after costs, mostly from breaks in the trend direction.
How often does NIFTY close back inside the opening range?
Often. In our test, after a close beyond the first-hour range, NIFTY 50 closed back inside it later the same day 42% of the time; for the 15-minute range, 60% of the time.
Practical Exercise
Paper-test the ORB.
Your task
Step 1: Choose a range length
15 minutes on Nifty futures.
Step 2: Record 40 sessions
Range width, gap, trigger, stop, exit and costs.
Step 3: Apply one filter
For example, only narrow ranges or only gap-direction breaks.
Step 4: Compare
Expectancy with and without the filter, after costs.
Check Your Understanding
NSE continuous trading starts at:
Related Lessons
Previous: Momentum Breakouts. Next: Previous-Day High/Low and Weekly Breakouts. See also the Day Trading course.