
Breakout Stop-Loss and Target Placement
JustWolves is an educational platform and is not a SEBI-registered investment advisor. Trading financial instruments involves significant risk of loss and may not be suitable for all investors. Past performance is not indicative of future results. Read our full disclaimer →
What you'll learn
- Breakout stops go where the breakout is proven to have failed: back inside the range, below the breakout candle, or below the retest low
- A buffer beyond the level, often a fraction of ATR, keeps stops out of normal noise
- Time stops suit breakouts: genuine breakouts usually move away from the level quickly
- Targets come from measured moves, the next higher-timeframe level, R-multiples or trailing stops
- Check reward-to-risk before entry; skip breakouts where the next level is too close
In this article · 15 sections
Breakout trades have a natural invalidation point: the level that just broke. If price returns well inside the range, the breakout has failed. That makes stops easier to define than in many setups, but there are still choices, each with a different trade-off between how often you're stopped out and how much each stop costs. This lesson covers those choices, time stops, and how to set targets that fit the breakout.
What You Will Learn
- Four places to put a breakout stop
- Buffers and time stops
- Target methods for breakouts
- Checking reward-to-risk before entry
Before You Start
Read False Breakouts, Bull Traps and Bear Traps. The Swing Trading course covers general stop placement in Stop Placement for Swing Trades.
Where to Put the Stop
| Stop location | Distance | Trade-off |
|---|---|---|
| Below the range low | Widest | Rarely hit by noise, but large risk per share |
| Below the last swing low inside the range | Moderate | Common default for base and triangle breakouts |
| Below the breakout candle's low | Moderate to tight | Fails if the breakout candle is very large |
| Below the retest low | Tightest | Only available after a retest forms |
Whichever you choose, the logic is the same: the stop marks where the breakout has clearly failed. A stop just below the breakout level itself is usually too tight, because healthy breakouts often retest that level.
Buffers
Price often probes just past obvious lows before turning. Adding a buffer, commonly 0.25 to 0.5 times the daily ATR (or the intraday ATR for intraday trades), keeps the stop outside that noise. The buffer increases the risk per share, so position size adjusts to keep rupee risk constant.
Real Prices: Three Stops on One Breakout
The chart below shows this lesson's stop choices on one real breakout: Sun Pharma in February and March 2026. A stop just below the level, a stop half an ATR below it, and a stop below the last swing low inside the base. The breakout worked, but only one of the three stops survived to see it.
Real prices: three stop placements on one breakout, Sun Pharma, February–March 2026
Step 1 of 4
The breakout and three stops
Sun Pharma bases between about ₹1,684 and ₹1,731 through February 2026. On 23 February it closes at ₹1,732.3, just above the base top of ₹1,730.6. Three traders buy: one with a stop just below the level (₹1,728), one half an ATR below it (₹1,717.6), and one below the last swing low inside the base with a quarter-ATR buffer (₹1,686.9, ₹45 of risk).
- What to observe
- This lesson's stop table, on one real trade.
- Condition
- ATR is about ₹26.
Time Stops
Genuine breakouts tend to move away from the level fairly quickly, as triggered orders and new demand push price. A breakout that hovers just above the level for many sessions is often losing its energy.
A time stop exits if the trade hasn't reached a set progress point, such as +1R, within a set period: perhaps five to ten sessions on daily charts, or a set number of candles intraday. Time stops free capital and attention for better opportunities and reduce losses on breakouts that slowly fail.
Target Methods
| Method | How | Notes |
|---|---|---|
| Measured move | Range or pattern height added to the breakout level | Traditional; a guide only |
| Next higher-timeframe level | Weekly resistance or a prior swing high | Often where breakouts pause |
| R-multiple | 2R or 3R from entry | Consistent; ignores the chart |
| Trailing stop | Below swing lows, a moving average or ATR-based | Captures larger trends |
Many breakout traders combine a fixed first target, where they take partial profit, with a trailing stop for the remainder. That locks in some gains on breakouts that stall, while staying in the ones that become trends.
Check Reward-to-Risk First
Before entering, measure the distance to the stop and to the nearest obstacle above. If a weekly resistance level sits just 1R above the entry, the breakout has little room to run, however good it looks.
A common minimum is 1.5R to 2R to the first target. If a breakout can't offer that with a logical stop, many traders skip it or wait for a retest that improves the entry.
Practical Example
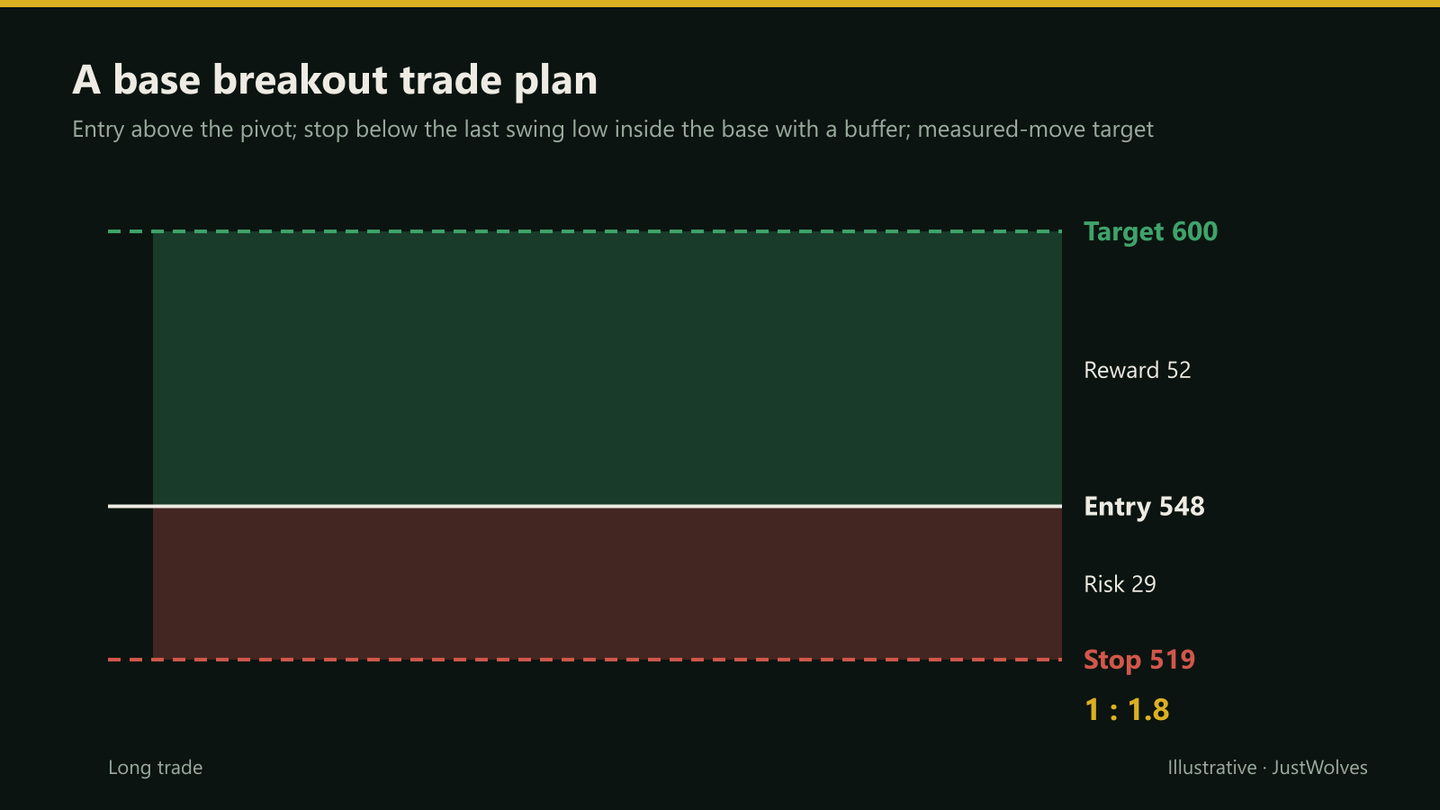
Hypothetically, a stock bases between ₹480 and ₹540 with a last swing low inside the base at ₹522, and ATR of ₹12. Divya plans a buy-stop at ₹548. Her stop goes a quarter of an ATR below that swing low, at ₹519, risking ₹29. Her first target is the measured move at ₹600 (about 1.8R), where she'll sell half.
She adds a time stop: if price hasn't reached ₹577 (+1R) within eight sessions, she'll exit. The breakout triggers, reaches ₹577 in four sessions, and she moves the stop on the remainder to breakeven.
Which Stops and Targets Worked? Our Test
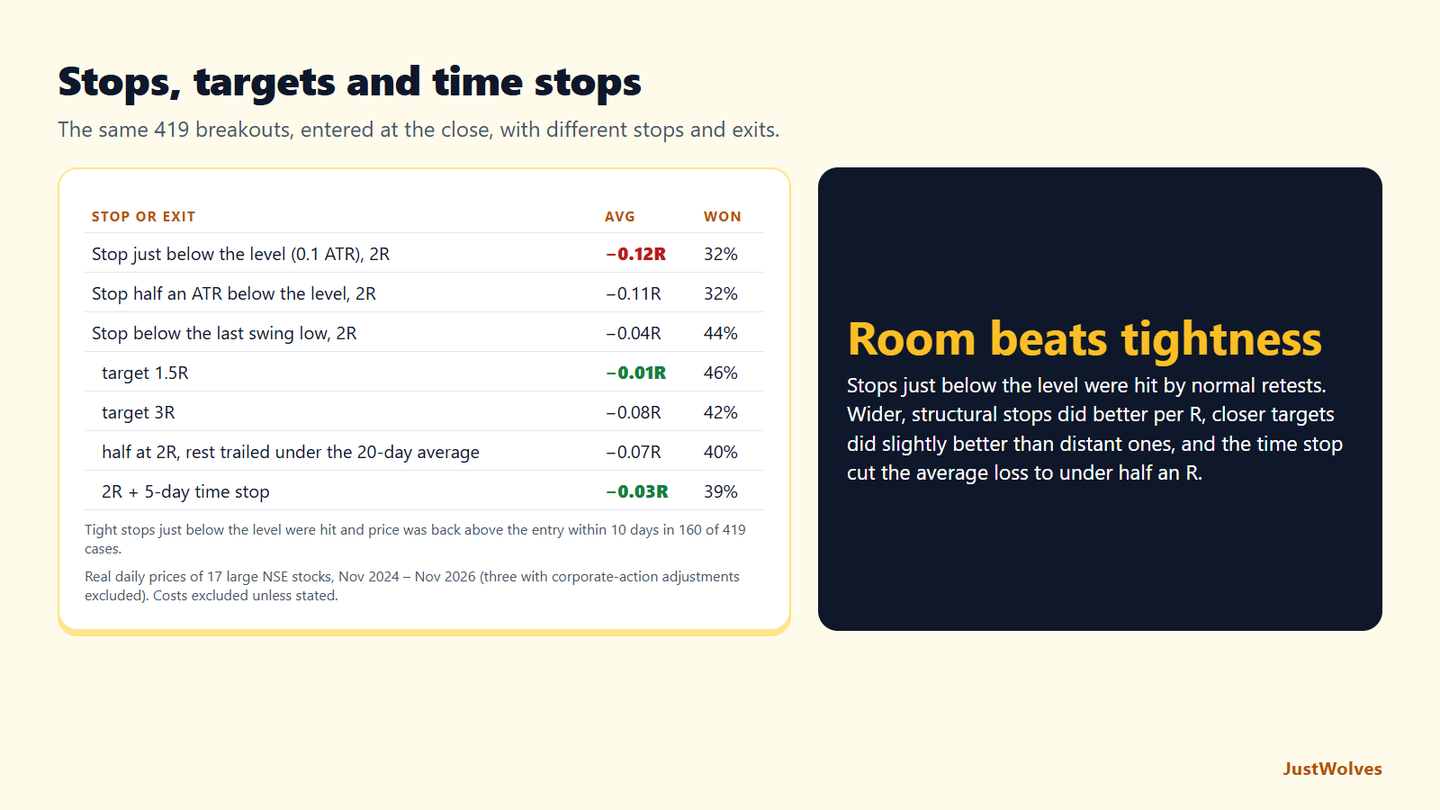
JustWolves compared this lesson's choices on about two years of daily prices for 17 large NSE stocks (November 2024 to November 2026): the same 419 closes above the prior 20-day high, entered at the close. Stops: just below the level (0.1 ATR), half an ATR below it, below the last swing low (the lowest low of the five days before the breakout, minus a quarter of an ATR), and below the range low. Targets and exits: 1.5R, 2R, 3R, the measured move, a trailing exit on a close below the 20-day average, half at 2R with the rest trailed, and a five-day time stop.
| Stop | Average risk | Trade average | Won | Stopped, then back above entry within 10 days |
|---|---|---|---|---|
| Just below the level (0.1 ATR) | 0.6 ATR | −0.12R | 32% | 160 of 419 |
| Half an ATR below the level | 1.0 ATR | −0.11R | 32% | 128 |
| Below the last swing low (− 0.25 ATR) | 3.4 ATR | −0.04R | 44% | 17 |
| Below the range low (− 0.25 ATR) | 5.5 ATR | −0.07R | 47% | 5 |
| Exit | Trade average | Won | Average loss |
|---|---|---|---|
| Target 1.5R | −0.01R | 46% | −0.90R |
| Target 2R | −0.04R | 44% | −0.90R |
| Target 3R | −0.08R | 42% | −0.90R |
| Measured move (range height) | −0.05R | 47% | −0.90R |
| No target; exit on a close below the 20-day average | −0.08R | 34% | −0.52R |
| Half at 2R, rest trailed under the 20-day average | −0.07R | 40% | −0.66R |
| 2R with a 5-day time stop (exit unless 1 ATR above the level) | −0.03R | 39% | −0.47R |
Tight stops were the worst choice, as this lesson says. A stop just below the level was hit and then price recovered above the entry within ten days in 160 of 419 trades: more than a third. Stops below the last swing low, about 3.4 ATR away on average, did best per R. They need much smaller positions for the same rupee risk, which is this lesson's point about adjusting size, not distance.
Closer targets did slightly better than distant ones. With the swing-low stop, 1.5R averaged −0.01R and 3R averaged −0.08R. In this period breakouts that moved tended to stall before 3R, so the extra reward did not make up for the wins it gave away. The measured move landed in between.
Trailing exits and time stops reduced losses, not gains. Trailing under the 20-day average cut the average loss to about half an R but also the average win. The five-day time stop cut the average loss to −0.47R and gave the best result of the exit rules, supporting this lesson's professional insight that the time stop is underused, though the Sun Pharma chart shows its cost: it would have closed that trade before the move.
None of these combinations was profitable on its own across this two-year window. What they show is how much the exit rules change the shape of results, which is why this lesson asks you to decide them before the breakout triggers.
Common Mistakes
- Stops just below the breakout level.
- No buffer at obvious lows.
- Holding stalled breakouts indefinitely.
- Targets beyond major resistance.
- Deciding exits after entry.
Professional Insight
Many experienced breakout traders say the time stop is the most underused tool in breakout trading. Breakouts that work usually work quickly; ones that don't often drift back slowly, costing more than a clean stop-out would have. Exiting stalled trades early keeps losses small and capital available for the next setup.
Risk Considerations
- Gaps can skip stops.
- Tight stops raise the stop-out rate.
- Measured moves can fall short.
Important Terminology
| Term | Meaning |
|---|---|
| Invalidation point | Where the breakout is proven to have failed. |
| Buffer | Extra distance beyond a level to avoid noise. |
| Time stop | An exit if the trade doesn't progress within a set period. |
| Measured move | A target based on range or pattern height. |
| Partial exit | Selling part of a position at a target. |
Where should I put my stop on a breakout trade?
Below the last swing low inside the range, the breakout candle's low, or the retest low, with a small ATR buffer.
Should my stop be just below the breakout level?
Usually not; healthy breakouts often retest the level, so the stop belongs further inside.
What is a time stop?
An exit if the trade hasn't made set progress within a set period.
How do I set a breakout target?
Use a measured move, the next higher-timeframe level, an R-multiple, or a trailing stop.
What reward-to-risk should a breakout offer?
Many traders require at least 1.5R to 2R to the first target.
Where should I put the stop on a breakout trade?
In our NSE test, below the last swing low inside the range, with a buffer of about a quarter of an ATR, did best: −0.04R per trade with a 2R target, against −0.12R for a stop just below the level, which was hit by normal retests in more than a third of trades.
Does a time stop help breakout trades?
It helped a little in our test on 17 NSE stocks. Exiting after five days unless the close was 1 ATR above the level cut the average loss from −0.90R to −0.47R and improved the average to −0.03R per trade, though it also cut some trades that worked later.
Practical Exercise
Compare stop methods.
Your task
Step 1: Take 20 past breakouts
Including failures.
Step 2: Apply four stops
Range low, last swing low, breakout candle low, retest low.
Step 3: Add a time stop
Exit if +1R isn't reached within eight sessions.
Step 4: Total the results
Which combination gave the best result in R?
Check Your Understanding
A stop just below the breakout level is often:
Related Lessons
Previous: False Breakouts, Bull Traps and Bear Traps. Next: Breakout Risk Management, Backtesting and Examples. See also Stop-Loss Orders: Where to Place Them and How They Work.