
Previous-Day High/Low and Weekly Breakouts
JustWolves is an educational platform and is not a SEBI-registered investment advisor. Trading financial instruments involves significant risk of loss and may not be suitable for all investors. Past performance is not indicative of future results. Read our full disclaimer →
What you'll learn
- The previous day's high and low (PDH and PDL) are among the most widely watched intraday levels
- The previous week's high and low play the same role for swing traders on daily charts
- Breaks after an inside day or a narrow-range day tend to be cleaner
- Many breaks of these levels fail, so a close beyond the level and a quick exit on failure matter
- Targets often come from the next reference level: the day's average range, the weekly level, or prior swing points
In this article · 15 sections
Every trader can see yesterday's high and low, which is exactly why they matter. Stops cluster just beyond them, breakout orders wait above and below them, and a break often triggers a burst of activity. The same logic applies one level up: the previous week's high and low are reference points for swing traders. This lesson covers how to trade breaks of these levels intraday and on daily charts, the setups that improve them, and how to handle the frequent failures.
What You Will Learn
- Why previous-period highs and lows matter
- Intraday PDH and PDL breakouts
- Weekly high and low breakouts on daily charts
- Inside days, filters and failure management
Before You Start
Why These Levels Matter
The previous day's high marks the furthest buyers could push price in the last session, and the low marks the furthest sellers could push it. Intraday traders place stops and entry orders around them, so they're natural places for orders to cluster.
A move beyond the previous day's high means today's buyers are willing to pay more than anyone did yesterday. Whether that continues depends on whether real demand follows the burst of triggered orders.
Intraday PDH and PDL Breakouts
A basic PDH long
Step 1: Mark the levels
Previous day's high and low, plus today's opening range.
Step 2: Wait for the break
A 5 or 15-minute close above the PDH, not just a tick through it.
Step 3: Entry
On that close, or on a retest of the PDH that holds.
Step 4: Stop
Below the breakout candle's low or back below the PDH by a buffer.
Step 5: Target and time
A multiple of risk or a projected daily range; exit by a set time.
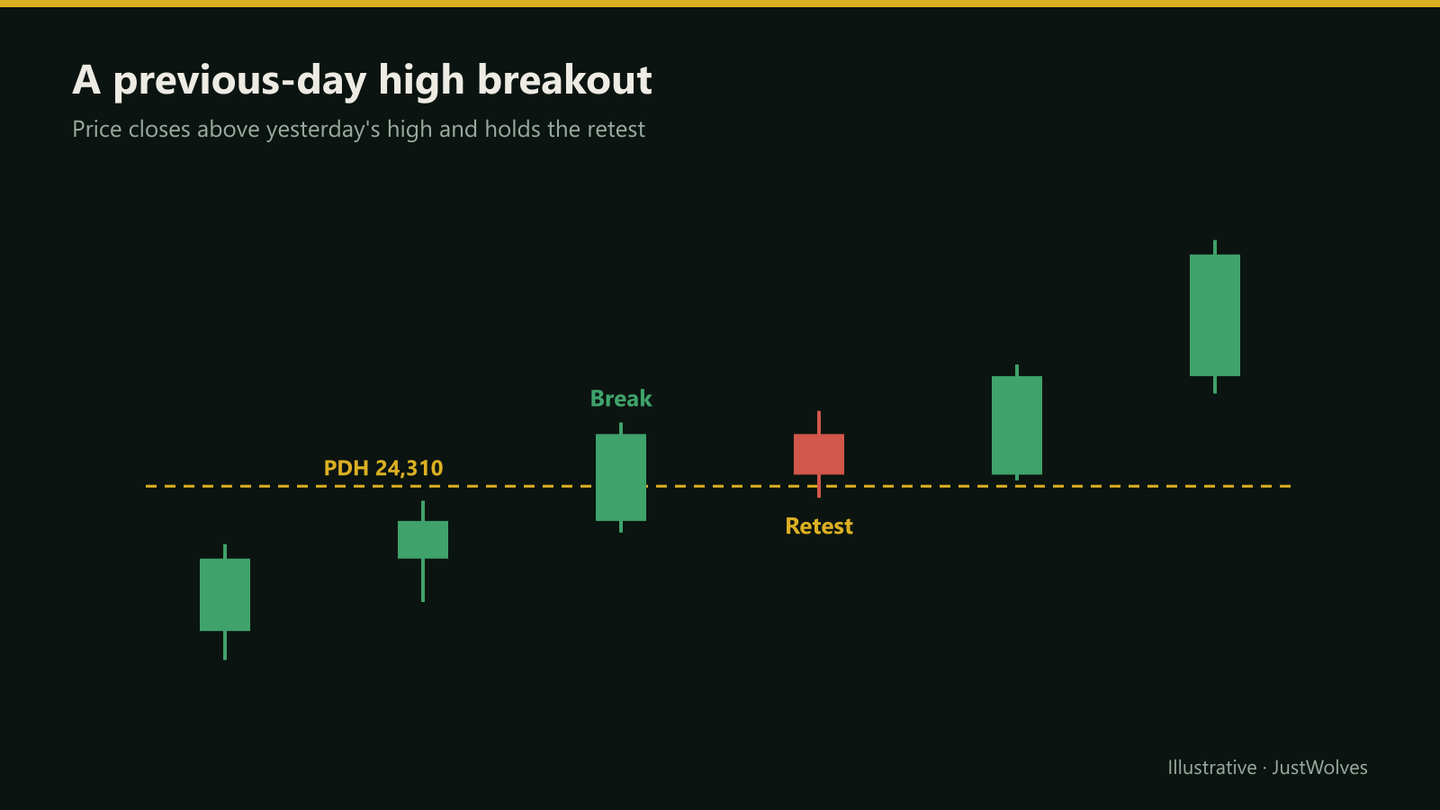
Real Prices: A Break of Yesterday's High
The chart above uses hypothetical prices. The chart below shows a real break of the previous day's high on NIFTY 50 on 6 November 2026: a poke that failed to close above the level, a close that did, and a dip back to the level that held.
Real prices: a previous-day high break that held, NIFTY 50, 6 November 2026
Step 1 of 4
Yesterday's high
On 5 November 2026 NIFTY 50 gapped up and rose to a high of 24,579.3. On 6 November it opens below that level, and the 9:30 candle pokes above it to 24,581.7 but closes at 24,573.3, under the high.
- What to observe
- A touch, not a close: this lesson's first mistake to avoid.
- Condition
- The daily trend is up.
Weekly Breakouts for Swing Traders
On daily charts, the previous week's high and low play the same role. A daily close above last week's high in a stock with a rising trend suggests buyers are extending the move. Some swing traders use it as a trigger after a pullback: the pullback ends, and a close above the prior week's high confirms the trend has resumed.
The same approach works one level higher: monthly highs and lows for position traders. The longer the period, the more significant the level, and the fewer the signals.
Inside Days and Narrow Ranges
When the previous day was an inside day (its range within the day before) or a narrow-range day, its high and low are close together. Breaks of that compressed range tend to be cleaner and allow tighter stops.
Some traders combine these: an inside day that also sits just below a weekly high is a setup where both levels can break together.
Filters
- Trend: breaks of the PDH in an uptrend, or the PDL in a downtrend, tend to work better than counter-trend breaks.
- Gap: if today opened well above the PDH, the level may already be behind price; the opening range matters more.
- Timing: breaks in the first hour or after lunch often behave differently; test your own data.
- Range already used: if price has already moved more than its average daily range by the time of the break, there may be little left.
Practical Example
Hypothetically, the previous day was an inside day for Nifty futures, with a high of 24,310 and a low of 24,180. The daily trend is up. At 10:30, a 15-minute candle closes at 24,328. Gautam buys one lot (65 units) at 24,330 with a stop at 24,288, risking 42 points, about ₹2,730 before costs.
The next candle dips to 24,306 and closes at 24,314, holding above the PDH. Price then rises, and he exits at 24,400 at 1:30 pm, 70 points or about 1.7R, roughly ₹4,550 before costs. Round-trip charges at discount-broker rates are about ₹945, so he keeps about ₹3,605.
How Often Do These Breaks Hold? Our Test
JustWolves tested this lesson's intraday rules on NIFTY 50 hourly prices from November 2023 to November 2026, used as a guide to NIFTY futures. On days that opened inside the previous day's range, we took the first hourly close above the previous day's high (long) or below its low (short), up to 2:15 pm. The stop sat a quarter of the previous day's range beyond the level; the exit was 2R or the day's last candle; costs were 14.5 index points a round trip. We also tested the weekly version on daily prices of 17 large NSE stocks (November 2024 to November 2026): the first close above the previous week's high.
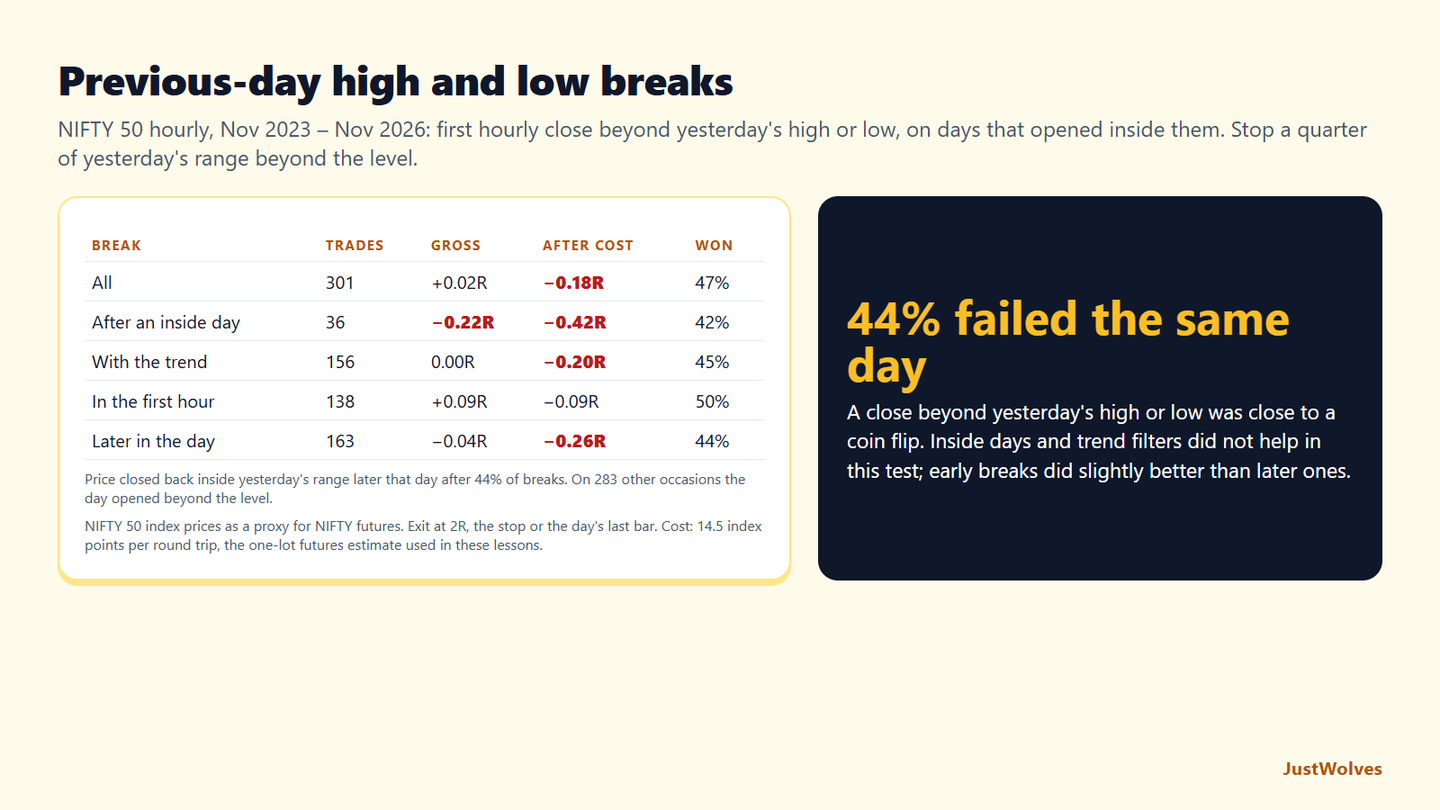
| Break | Trades | Gross | After costs | Won |
|---|---|---|---|---|
| All | 301 | +0.02R | −0.18R | 47% |
| After an inside day | 36 | −0.22R | −0.42R | 42% |
| Not after an inside day | 265 | +0.05R | −0.15R | 47% |
| With the trend (prior close vs 20-day average) | 156 | 0.00R | −0.20R | 45% |
| Against the trend | 145 | +0.04R | −0.16R | 48% |
| Break in the first hour | 138 | +0.09R | −0.09R | 50% |
| Break later in the day | 163 | −0.04R | −0.26R | 44% |
| First close above the previous week's high | Cases | Up 10 days later | Average 10-day move | Trade average |
|---|---|---|---|---|
| Stock above a rising 50-day average | 270 | 48% | −0.39% | −0.06R |
| Other stocks | 273 | 51% | +0.52% | +0.09R |
| All days, for comparison | – | 50% | +0.21% | – |
These levels were close to a coin flip. Breaks of yesterday's high or low made almost nothing before costs and lost about a fifth of an R after them. In 44% of cases, price closed back inside the previous day's range later the same day: the stop runs this lesson's warning box describes.
The usual filters did not help in this test. Breaks after an inside day did worse, not better, although there were only 36 of them. Breaks in the direction of the trend did no better than counter-trend breaks. The one difference that showed up was timing: breaks in the first hour did better than later ones, which matches the lesson's suggestion to test timing on your own data.
The weekly version showed no edge either. On 17 NSE stocks, a first close above last week's high was followed by gains about as often as an average day, and slightly less in rising stocks than in others during this two-year window.
What the data supports is this lesson's professional insight: these levels are worth marking because of what price does around them, not because a break is a signal. A break that holds on a retest, as in the chart above, tells you more than the break itself, and a quick return inside the range is a reason to exit at once.
Common Mistakes
- Buying the first tick above the PDH.
- Ignoring gaps that put the level far behind price.
- Counter-trend breaks taken at full size.
- Holding failed breaks as price returns inside the range.
- No time cut-off for intraday trades.
Professional Insight
Many experienced intraday traders watch what price does at the previous day's levels more than whether it breaks them. A break that holds and is retested successfully tells them buyers are in control; a quick poke and reversal tells them the opposite. Both are tradable, which is why they mark these levels every morning.
Risk Considerations
- Stop runs around obvious levels.
- Intraday leverage magnifies losses.
- Costs reduce small intraday gains.
Important Terminology
| Term | Meaning |
|---|---|
| PDH / PDL | Previous day's high and low. |
| PWH / PWL | Previous week's high and low. |
| Inside day | A day whose range is within the previous day's range. |
| Narrow-range day | A day with an unusually small range. |
| Stop run | A move beyond a level that triggers stops, then reverses. |
What is a previous day high breakout?
A trade taken when price moves and closes above the previous session's high.
Why does the previous day's high matter?
It's widely watched, so stops and breakout orders cluster around it.
Do weekly high breakouts work for swing trading?
Many swing traders use a daily close above the prior week's high as a trigger, especially after a pullback in an uptrend.
What is an inside day?
A day whose high and low are both within the previous day's range.
Why do PDH breakouts fail?
Because obvious levels attract stop runs: price pokes beyond them and reverses.
Does a previous-day high breakout work on NIFTY?
Not as a stand-alone signal in our test. Over three years of NIFTY 50 hourly prices, the first close beyond the previous day's high or low averaged +0.02R per trade before costs and −0.18R after a 14.5-point round-trip cost, and 44% of breaks closed back inside the same day.
Are breakouts after an inside day better?
Not in our NIFTY 50 data. Breaks of the previous day's high or low after an inside day averaged −0.22R per trade before costs, worse than other days (+0.05R), though the sample was small at 36 trades.
Practical Exercise
Study PDH and PDL behaviour.
Your task
Step 1: Mark levels daily
PDH and PDL on Nifty futures for 30 sessions.
Step 2: Record breaks
Time, whether a close confirmed, and the outcome.
Step 3: Separate inside days
Compare breaks after inside days with others.
Step 4: Note failures
How quickly did failed breaks return inside?
Check Your Understanding
PDH means:
Related Lessons
Previous: Opening Range Breakout (ORB). Next: Chart Pattern Breakouts: Triangles, Flags and Pennants. See also Inside Bars and Outside Bars.