
Pullback Continuation Setups
JustWolves is an educational platform and is not a SEBI-registered investment advisor. Trading financial instruments involves significant risk of loss and may not be suitable for all investors. Past performance is not indicative of future results. Read our full disclaimer →
What you'll learn
- A healthy pullback is smaller and slower than the move before it, often on lighter volume
- Pullbacks commonly end near support, a rising moving average, a prior breakout level or the 38.2–61.8% retracement zone
- Wait for a trigger showing the pullback has ended, rather than buying while price is still falling
- The stop goes below the pullback low; the first target is usually the prior swing high
- A pullback that breaks the last higher low is no longer a pullback
In this article · 15 sections
The trend pullback is the setup many swing traders build their trading around. The idea is simple: in an established trend, buy when price pauses and starts to resume. The skill is in telling a healthy pullback from the start of a reversal, and in waiting for the pause to end before entering. This lesson covers both, with the common pullback shapes and a full worked trade.
What You Will Learn
- How to tell healthy pullbacks from unhealthy ones
- Where pullbacks tend to end
- Common pullback shapes
- Entries, stops and targets for pullback trades
Before You Start
Read The Three Core Swing Setups first.
Healthy vs Unhealthy Pullbacks
| Feature | Healthy pullback | Warning sign |
|---|---|---|
| Size | Smaller than the prior upswing | Gives back most of the upswing |
| Speed | Slower, overlapping candles | Fast, large bearish candles |
| Volume | Lighter than during the advance | Heavier than during the advance |
| Structure | Holds above the last higher low | Breaks the last higher low |
| Weekly trend | Still up | Turning down |
No single sign is decisive, but a pullback that is fast, deep, heavy and breaks structure is more likely to be the start of something larger.
Where Pullbacks Tend to End
- Prior resistance turned support, such as a previous breakout level.
- A rising moving average, commonly the 20 or 50-day.
- The 38.2–61.8% retracement zone of the last upswing.
- A rising trendline connecting earlier higher lows.
The strongest pullback zones combine two or more of these. A pullback to an old breakout level that also sits on the rising 50-day average has more reasons to hold than one that reaches only an arbitrary percentage.
Common Pullback Shapes
| Shape | What it looks like |
|---|---|
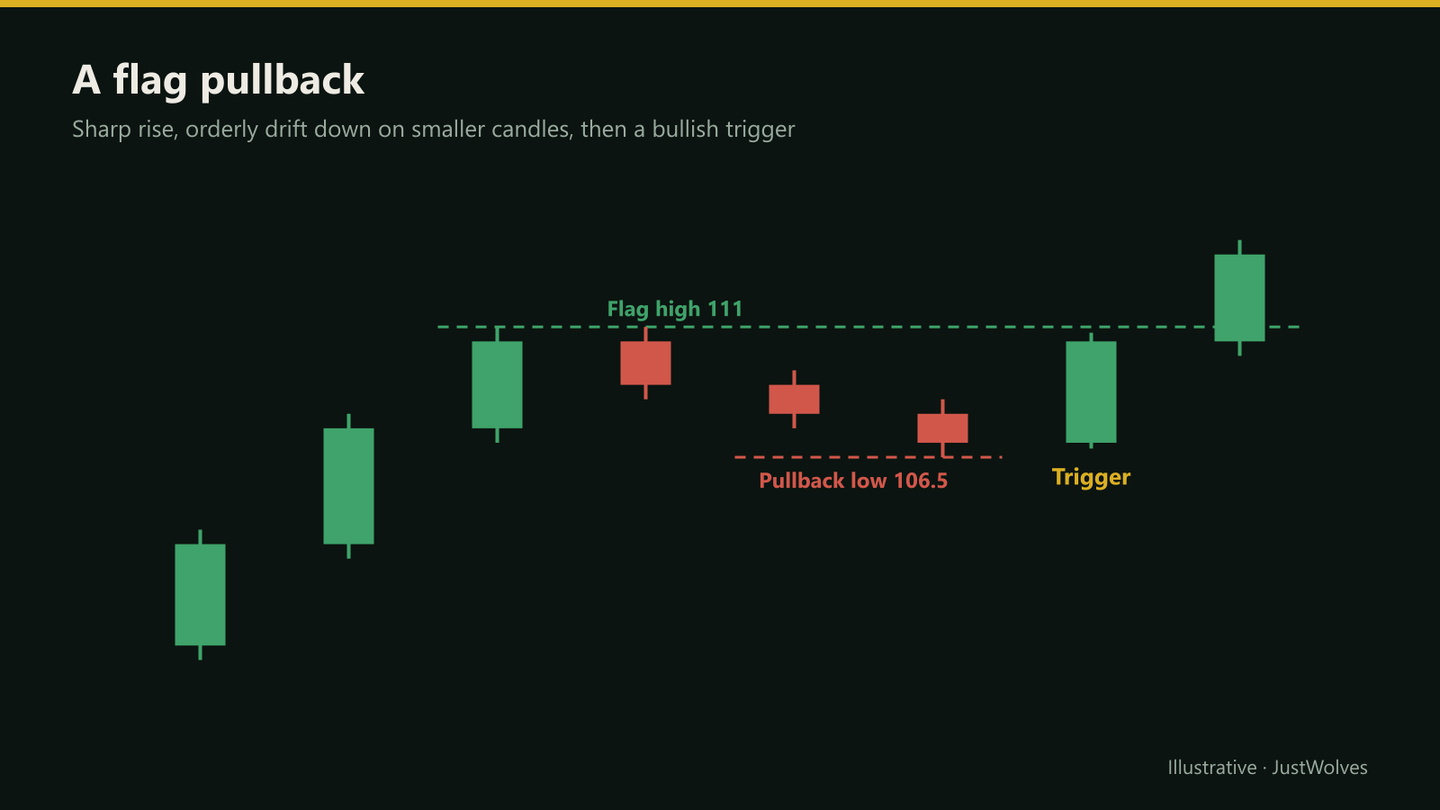
| Flag | A short, orderly drift down after a sharp rise, often in a narrow channel |
| Breakout retest | Price returns to a level it recently broke above, then holds |
| Two-leg (ABC) pullback | A dip, a small bounce, a second dip that holds near the first |
| Tight consolidation | Sideways candles near the highs instead of a dip |
Entry Triggers
Buying while price is still falling means guessing where the pullback ends. Most pullback traders wait for a trigger: a bullish reversal candle at the zone, a close above the previous day's high, or a break above the small downtrend line of the pullback. Entry Confirmation and Timing compares these.
Waiting costs some price, but it filters out pullbacks that keep falling into reversals.
Stops and Targets
The stop goes below the pullback low, with a buffer for normal noise, often a fraction of the daily ATR. If that makes the stop too far for your risk limit, reduce the position size rather than moving the stop closer.
The first target is usually the prior swing high, where sellers stepped in before. Many traders take partial profit there and trail the rest, using a moving average or the next higher low, to stay in the trade if the trend continues.
Real Prices: A Healthy Pullback to a 2R Target
Deepak's example in this lesson uses round numbers. The chart below follows the same steps on real State Bank of India prices from August and September 2025: a light-volume pullback near the rising averages, a trigger, a stop below the pullback low with a buffer, and a 2R target.
Real prices: a light-volume pullback and a 2R target, State Bank of India, August–September 2025
Step 1 of 4
A quiet pullback
In late August 2025 SBI pulls back from about ₹820 to ₹798.5 and then drifts sideways near its 20-day EMA and rising 50-day average (about ₹811). Volume runs at 0.6 to 1.0 times average, and RSI holds in the 40s.
- What to observe
- Light volume, shallow, structure intact: the healthy column of this lesson's table.
- Condition
- Wait for a trigger, not a guess.
Practical Example
Hypothetically, an auto stock in a weekly uptrend breaks above resistance at ₹2,400 and rallies to ₹2,620. It then pulls back for six sessions on lighter volume, to ₹2,425, just above the old breakout level and near its rising 50-day average.
On the seventh day, a bullish candle closes at ₹2,468, above the previous day's high. Deepak buys at ₹2,470, with a stop at ₹2,385 (below the pullback low and the breakout level, about 1 ATR below). Risk is ₹85 a share. With ₹5,000 to risk, he buys 58 shares. His first target is ₹2,620, about 1.8R; he sells half there and trails the rest below each new daily higher low.
Do Healthy Pullbacks Work Better? Our Test
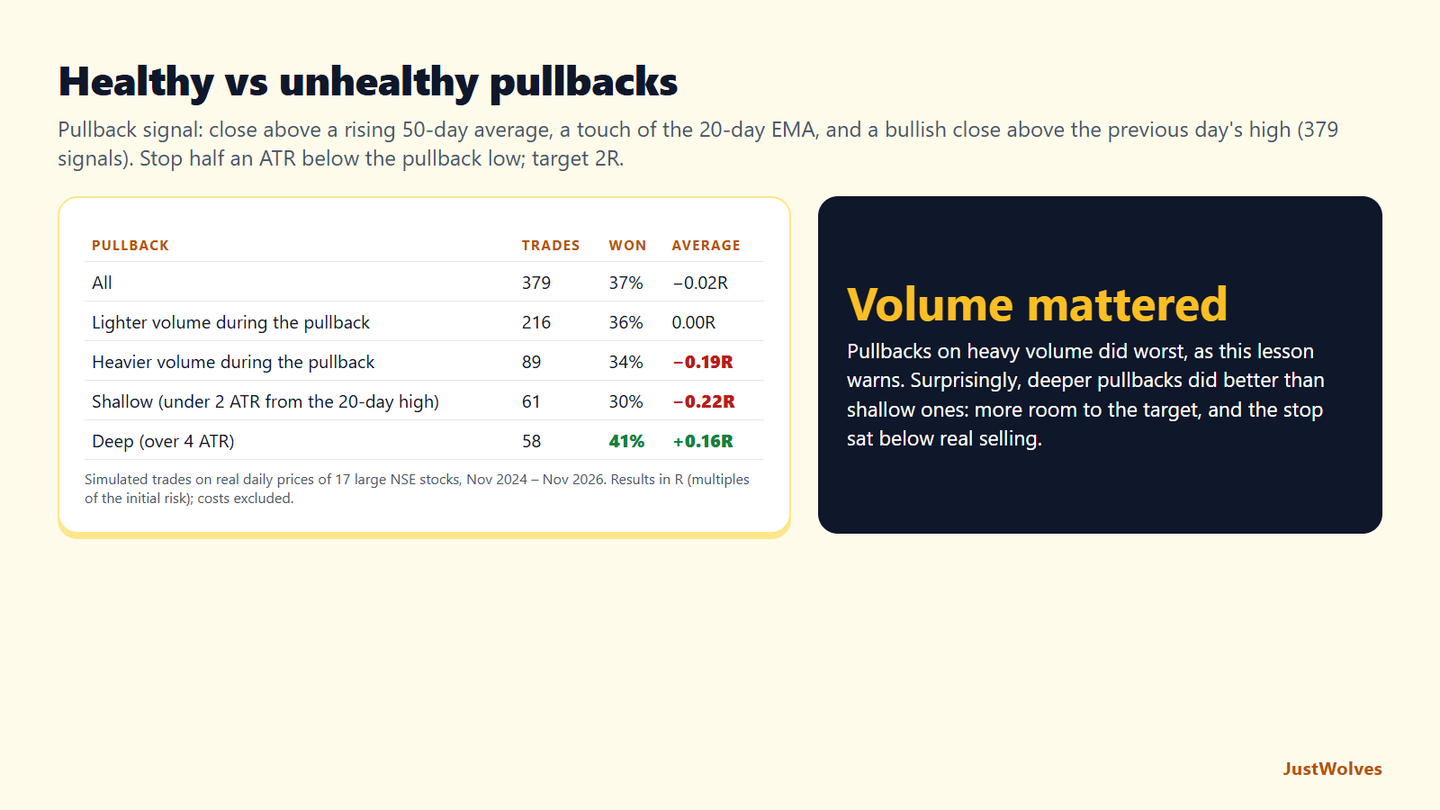
JustWolves simulated this lesson's setup on about two years of daily prices for 17 large NSE stocks (November 2024 to November 2026). Signal: a close above a rising 50-day average, a touch of the 20-day EMA in the last two days, and a bullish close above the previous day's high: 379 signals. Trade: buy at that close, stop half an ATR below the pullback low, target 2R, results in R (multiples of the risk). We then split the signals using two signs from this lesson's health table: volume during the pullback, and how deep it was.
| Pullback | Trades | Won | Average |
|---|---|---|---|
| All signals | 379 | 37% | −0.02R |
| Lighter volume during the pullback (under 0.9× prior) | 216 | 36% | 0.00R |
| Heavier volume during the pullback (over 1.1×) | 89 | 34% | −0.19R |
| Shallow: under 2 ATR from the 20-day high | 61 | 30% | −0.22R |
| Deep: more than 4 ATR from the 20-day high | 58 | 41% | +0.16R |
Overall, the mechanical pullback had no edge in this period: 37% of trades reached 2R first, and the average result was close to zero, as in the earlier lessons of this course. That is not the same as saying pullback trading does not work; it says that a simple mechanical version did not, in two years that included two sharp falls.
Volume behaved as this lesson's health table says. Pullbacks on heavy volume, where sellers were active, did worst, about −0.19R per trade. Light-volume pullbacks were about breakeven. Treat heavy selling in a pullback as a reason to wait.
Depth surprised us. Shallow pullbacks, less than 2 ATR from the recent high, did worse than deep ones of more than 4 ATR. A shallow pullback leaves the target at the old high close by and the stop inside recent noise; a deeper one, like the 62% median depth in the Fibonacci lesson's test, gives the trade more room. That fits this lesson's zones list: the strongest pullbacks end at real support, not simply soon. With about 60 trades in each group, treat this as a lead to check in your own journal.
Common Mistakes
- Buying before the pullback ends.
- Treating any dip as a pullback, even after the trend breaks.
- Ignoring heavy-volume selling in the pullback.
- Stops right at the zone, where noise reaches.
- Targets beyond weekly resistance without adjusting expectations.
Professional Insight
Experienced pullback traders tend to be most selective about the trend itself. They prefer stocks that have recently broken out to new highs, are leading their sector, and are pulling back for the first or second time since the breakout. Later pullbacks in an older trend are more likely to fail. They also check that the broader market, such as the Nifty 50 or the stock's sector index, isn't breaking down at the same time, since individual pullbacks rarely hold when the whole market is falling.
Risk Considerations
- Pullbacks become reversals when structure breaks.
- Late-trend pullbacks fail more often.
- Overnight gaps can open below the stop.
Important Terminology
| Term | Meaning |
|---|---|
| Pullback | A temporary move against the trend. |
| Flag | A short, orderly pullback after a sharp move. |
| Breakout retest | A return to a broken level that then holds. |
| Trigger | The event that confirms the entry. |
| Higher low | A swing low above the previous one. |
What is pullback trading?
Buying a temporary dip in an uptrend (or selling a rally in a downtrend) as the trend resumes.
How do I know a pullback has ended?
Look for a trigger at a support zone, such as a bullish reversal candle or a close above the previous day's high.
How deep should a pullback be?
Many healthy pullbacks retrace about 38.2–61.8% of the prior swing, but depth varies; structure matters more.
Where do I put the stop?
Below the pullback low, with a buffer for normal noise.
When is a pullback no longer a pullback?
When price closes below the last higher low, breaking the uptrend's structure.
Does a pullback on low volume work better?
Somewhat, in our test. In 379 simulated pullback trades on 17 NSE stocks, pullbacks on heavier volume averaged −0.19R per trade, while those on lighter volume averaged about 0R. Heavy selling during a pullback is a reason to wait for more evidence.
Are shallow pullbacks safer than deep ones?
Not in our data. Shallow pullbacks, less than 2 ATR from the recent high, averaged −0.22R per trade, while deep ones of more than 4 ATR averaged +0.16R. Deeper pullbacks to real support gave the stop and target more room.
Practical Exercise
Study pullbacks.
Your task
Step 1: Find 20 pullbacks
In uptrending stocks on daily charts.
Step 2: Score each
Size, speed, volume and structure from the table above.
Step 3: Record outcomes
Did the trend resume to a new high?
Step 4: Compare
Did high-scoring pullbacks succeed more often?
Check Your Understanding
A healthy pullback is usually:
Related Lessons
Previous: The Three Core Swing Setups. Next: Reversal Setups for Swing Traders. See also Moving Average Swing Strategies.