
Reversal Setups for Swing Traders
JustWolves is an educational platform and is not a SEBI-registered investment advisor. Trading financial instruments involves significant risk of loss and may not be suitable for all investors. Past performance is not indicative of future results. Read our full disclaimer →
What you'll learn
- Reversal trades go against the recent trend, so they need stronger context and more confirmation than pullbacks
- Good context: an extended move into a major weekly level, with momentum fading
- Three common reversal setups: the failed breakdown, the double bottom, and the higher low with a break of structure
- Enter after structure changes, not on the first bullish candle at support
- Expect lower win rates or smaller size; reversals that work can offer good reward-to-risk
In this article · 16 sections
Buying near the bottom of a decline is appealing: the price is low and the potential move is large. It is also where many swing traders lose the most, because most declines that look stretched keep falling. Reversal setups are worth trading only with strong context and clear confirmation. This lesson covers the context to look for, three reversal setups that build in confirmation, and how to manage the extra risk.
What You Will Learn
- The context that makes a reversal worth considering
- Three reversal setups
- What counts as confirmation
- How to size and manage reversal trades
Before You Start
Context First
- Extended move: the decline has run for weeks and is stretched from its moving averages.
- Major level: price reaches weekly support, a prior base or a long-term moving average.
- Fading momentum: bullish divergence on RSI or MACD, or shrinking bearish candles.
- Selling climax or drying volume: a heavy-volume flush, or selling that dries up near the level.
Without at least the first two, a reversal trade is a guess. A stock falling through levels in the middle of a decline isn't a reversal candidate, however oversold it looks.
Setup 1: The Failed Breakdown
Price breaks below a clear support level, triggering stops and fresh short selling, and then closes back above the level within a session or two. The sellers who drove the breakdown are now trapped, and their buying to cover can fuel a rally.
Entry is usually on the close back above support or a break of the reclaim candle's high. The stop goes below the breakdown low. This setup appears across the course under different names, such as a spring or a sweep in Candle Range Theory.
Real Prices: A Failed Breakdown
The chart below shows Setup 1 on real Infosys prices from April to June 2026: a stock in an extended decline breaks below support, closes back above it two sessions later, and the reversal trade is managed with a stop below the breakdown low and a first target at resistance.
Real prices: a failed breakdown in a declining stock, Infosys, April–June 2026
Step 1 of 4
A stock in a decline
In late April 2026 Infosys trades near ₹1,150–1,190, well below a falling 50-day average near ₹1,300 and more than 10% under its recent highs. On 12–13 May it slides to a low of ₹1,121.
- What to observe
- Context first: an extended decline, as this lesson requires.
- Condition
- Not a buy just because it is low.
Setup 2: The Double Bottom
Price falls to a low, bounces, and falls again to roughly the same level, where it holds. The pattern is confirmed when price closes above the high of the bounce between the two lows, sometimes called the neckline.
Entering at the second low is aggressive; entering on the neckline break is conservative but costs more of the move. The stop goes below the lower of the two lows.
Setup 3: Higher Low and Break of Structure
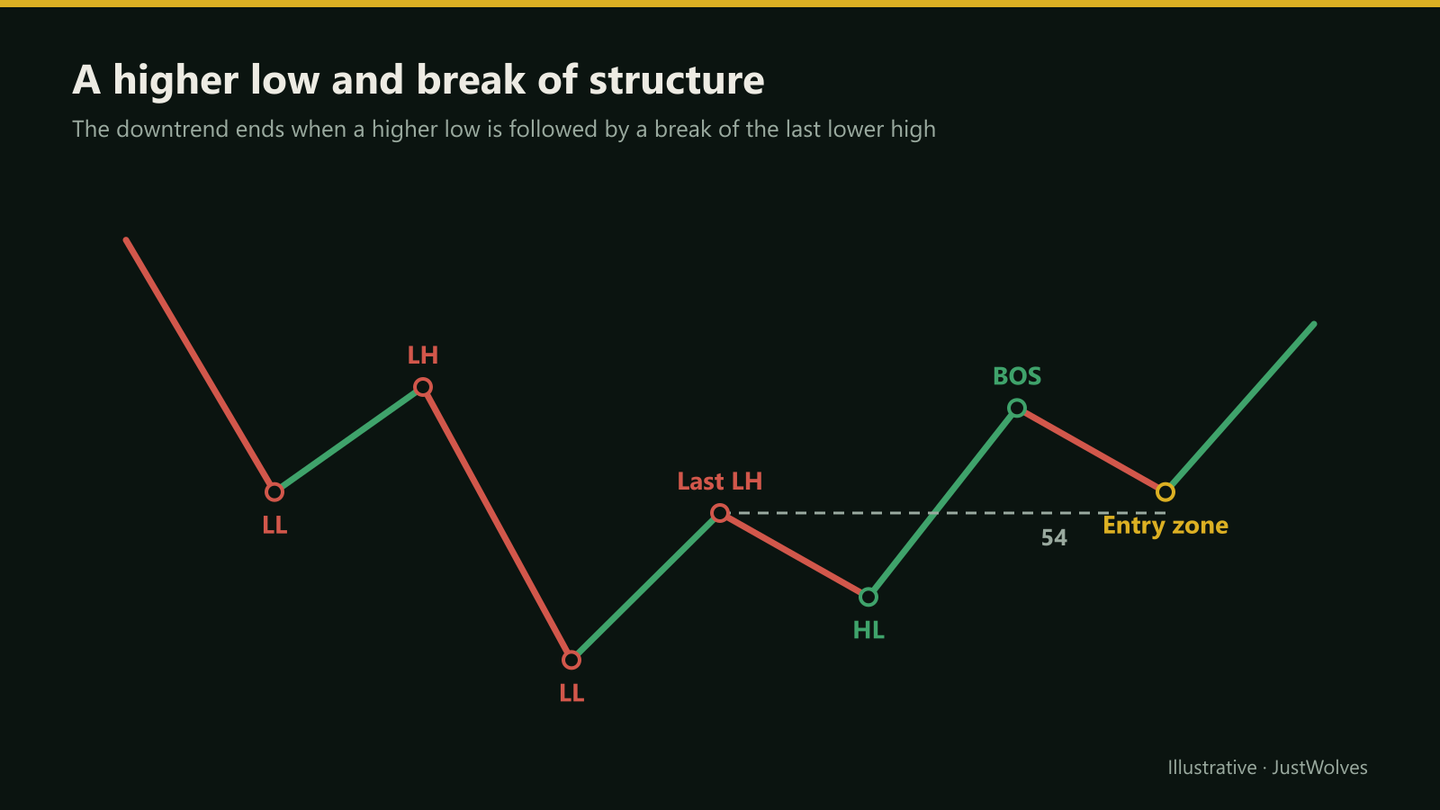
The most conservative reversal entry waits for the downtrend's structure to actually change: price makes a higher low, then breaks above the last lower high. At that point, the sequence of lower highs and lower lows has ended.
Many traders then buy the first pullback after the break, treating it like a new-trend pullback. The entry is further from the low, but the evidence is much stronger.
What Counts as Confirmation
| Evidence | Strength |
|---|---|
| A bullish candle at support | Weak on its own |
| Close back above a broken support level | Moderate |
| Bullish divergence plus a reclaim | Moderate |
| Higher low and break of the last lower high | Stronger |
| Weekly chart also turning | Stronger still |
Sizing and Managing Reversals
Reversal trades usually succeed less often than pullbacks in an established trend, because they bet on a change rather than a continuation. To compensate, many traders use smaller size, require a higher reward-to-risk ratio, or both.
The first target is usually the nearest resistance: often the last lower high or the declining 50-day average. Many reversals stall there, so taking partial profit and moving the stop to breakeven protects the trade if the old downtrend resumes.
Practical Example
Hypothetically, a metal stock falls from ₹180 to ₹128 over three months, reaching a weekly support zone near ₹125–130. RSI shows bullish divergence. Price breaks to ₹121, then closes back at ₹131 the next day: a failed breakdown.
Ananya buys at ₹132 with a stop at ₹119, below the breakdown low, risking ₹13 a share. She sizes at half her usual risk because it's a reversal. Her first target is the last lower high at ₹150 (about 1.4R); a second target at the declining 100-day average near ₹160 is about 2.2R.
Does Waiting for Confirmation Help? Our Test
This lesson's confirmation ladder says a structural change is stronger evidence than a bullish candle. JustWolves compared three entries on about two years of daily prices for 17 large NSE stocks (November 2024 to November 2026), all in declines, with the price below its 50-day average and more than 10% below its 50-day high. Failed breakdown: a close back above the 20-day low within two sessions of breaking it. Break of structure: a higher low followed by a close above the last lower high. First green candle: a bullish day after a bearish one with RSI below 35. Each trade used a stop half an ATR below the relevant low and a 2R target.
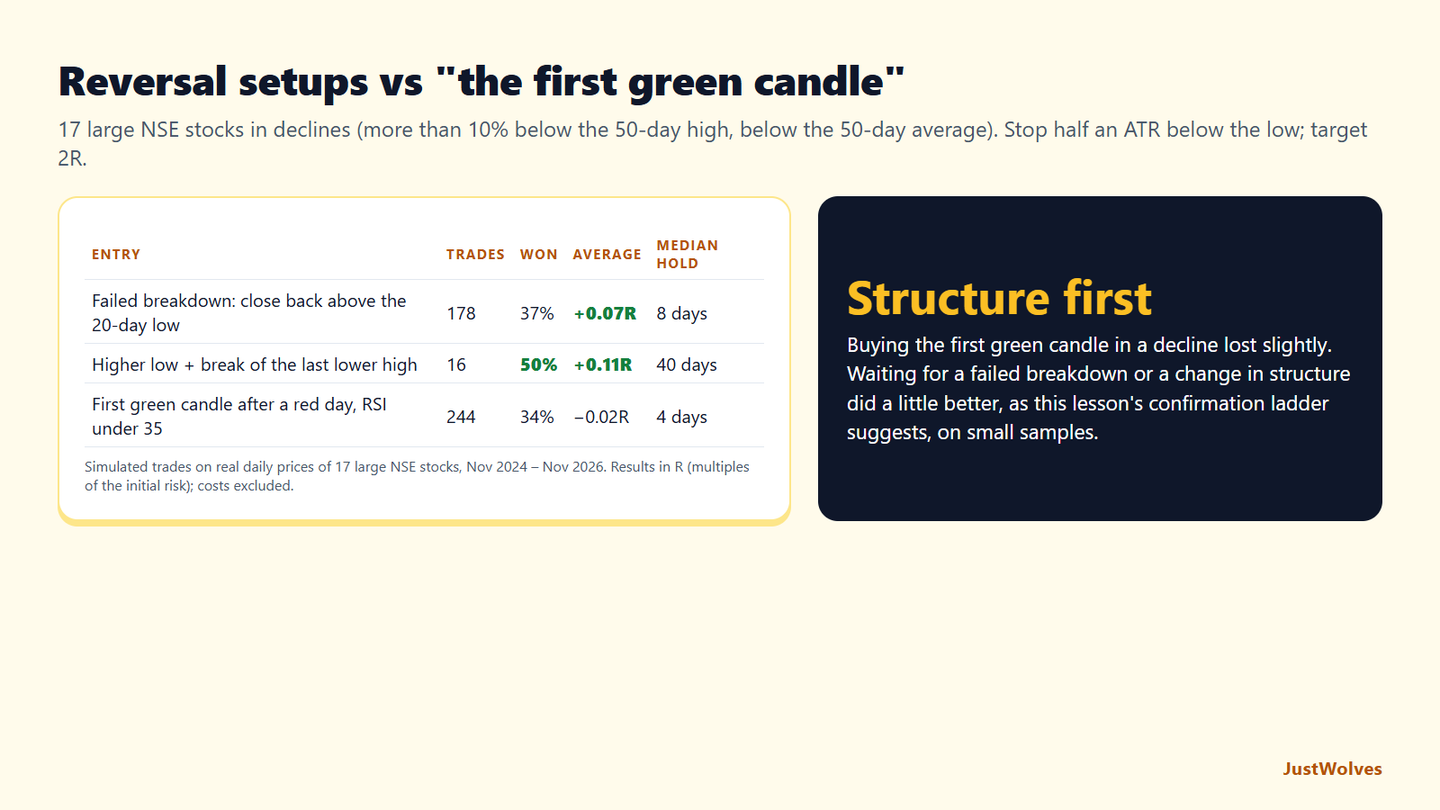
| Entry | Trades | Won | Average | Median hold |
|---|---|---|---|---|
| Failed breakdown: close back above the 20-day low | 178 | 37% | +0.07R | 8 days |
| Higher low + break of the last lower high | 16 | 50% | +0.11R | 40 days |
| First green candle after a red day, RSI under 35 | 244 | 34% | −0.02R | 4 days |
The ranking matched this lesson's confirmation ladder, but the gaps were small. Buying the first green candle in a decline, the "falling knife" in this lesson's callout, was the most common signal and lost slightly on average. Failed breakdowns did a little better, about +0.07R per trade. The full structural change, a higher low and a break of the last lower high, won half its trades but appeared only 16 times in two years and took a median of 40 days to resolve.
Reversals took either very little time or a lot. Green-candle entries were usually decided within four days, often by the stop. Structural reversals needed weeks, which fits this lesson's managing section: smaller size, and patience once the evidence is in.
The honest conclusion is the one in this lesson's professional insight. Confirmed reversals were slightly better than guesses, but none of these mechanical entries produced a large edge in this period. The Three Core Setups lesson found that a different reversal rule, after a sharp fall with RSI below 30, did better; reversal results depend heavily on the exact conditions and the period.
Common Mistakes
- Buying because a stock has 'fallen enough'.
- Entering on the first green candle.
- Ignoring the weekly downtrend.
- Full size on low-probability setups.
- Holding for a full trend reversal when the first resistance is close.
Professional Insight
Many experienced swing traders avoid reversals entirely and wait for the new trend to prove itself, entering on the first pullback after a break of structure. They give up the best price in exchange for much better odds, and they find it easier to follow rules that never require predicting a bottom.
Risk Considerations
- Counter-trend risk: the prior trend often resumes.
- Multiple false bottoms can drain an account.
- Gap-downs on news can skip stops.
Important Terminology
| Term | Meaning |
|---|---|
| Failed breakdown | A break below support that quickly reverses back above it. |
| Double bottom | Two lows near the same level, confirmed by a break of the neckline. |
| Neckline | The high between the two lows of a double bottom. |
| Break of structure | Price breaking the last swing that defined the trend. |
| Falling knife | A sharply declining stock that buyers try to catch. |
Is reversal trading profitable?
It can be for disciplined traders, but reversals usually succeed less often than trend trades, so they need strong context and careful sizing.
How do I confirm a reversal?
Look for a change in structure, such as a higher low followed by a break above the last lower high.
What is a failed breakdown?
A break below support that quickly closes back above it, trapping sellers.
Should I buy a double bottom at the second low?
That's the aggressive entry. The conservative entry waits for a close above the neckline.
Why do reversal trades fail?
Because the prior trend often resumes; a stock that looks oversold can keep falling.
Is buying the first green candle in a downtrend a good idea?
Not in our test. On 17 NSE stocks in declines, entering on a bullish day after a bearish one with RSI below 35 won 34% of trades with a 2R target and averaged slightly below breakeven over 244 trades. Waiting for a failed breakdown or a change in structure did a little better.
How long does a swing reversal take to work?
Often weeks. In our NSE test, reversals confirmed by a higher low and a break of the last lower high took a median of 40 trading days to reach the target or stop, while failed-breakdown trades took about 8.
Practical Exercise
Study reversals.
Your task
Step 1: Find ten major lows
On daily charts over several years.
Step 2: Identify the context
Was price at a weekly level after an extended move?
Step 3: Mark confirmation
Failed breakdown, double bottom or higher low and BOS?
Step 4: Find failures
Also mark five 'bottoms' that failed, and compare.
Check Your Understanding
Reversal trades need more confirmation because they:
Related Lessons
Previous: Pullback Continuation Setups. Next: Entry Confirmation and Timing. See also Reversals, Momentum and Exhaustion.