
Fibonacci Retracements and Extensions
JustWolves is an educational platform and is not a SEBI-registered investment advisor. Trading financial instruments involves significant risk of loss and may not be suitable for all investors. Past performance is not indicative of future results. Read our full disclaimer →
What you'll learn
- Fibonacci retracements mark common pullback depths: 38.2%, 50% and 61.8% of the previous swing
- They're drawn from swing low to swing high in an uptrend, and from swing high to swing low in a downtrend
- A retracement level carries more weight when it lines up with support, a moving average or a prior breakout level
- Extensions such as 127.2% and 161.8% are used as possible profit targets, not predictions
- There's no reliable evidence that Fibonacci ratios have special predictive power; treat them as a framework for zones
In this article · 15 sections
Fibonacci retracements are among the most popular swing trading tools, and among the most over-sold. Used well, they give a consistent way to measure how deep a pullback has gone and where to look for support or a target. Used badly, they become a set of lines that can justify any trade. This lesson covers how to draw them, how to combine them with structure, and what they can't do.
What You Will Learn
- How to draw Fibonacci retracements and extensions
- Which levels swing traders watch
- How to combine Fibonacci with structure
- The limitations of Fibonacci tools
Before You Start
The Levels
The ratios come from the Fibonacci number sequence, in which each number is the sum of the previous two (1, 1, 2, 3, 5, 8, 13…). Dividing numbers in the sequence gives ratios close to 0.618, 0.382 and 0.236. Charting platforms add 50%, which isn't a Fibonacci ratio but is widely watched, and 78.6%.
Retracement levels measure how much of the previous swing a pullback has given back. Extension levels project beyond the swing's end.
| Level | Common use |
|---|---|
| 23.6% | Shallow pullback in a strong trend |
| 38.2% | Common pullback depth in healthy trends |
| 50% | Mid-point; widely watched |
| 61.8% | Deeper pullback; often the last level before the trend is questioned |
| 78.6% | Very deep; the trend may be failing |
| 127.2% and 161.8% extensions | Possible targets beyond the previous high |
Drawing Them Correctly
Uptrend retracement
Step 1: Find a clear swing
A completed move from a swing low to a swing high on the daily chart.
Step 2: Anchor at the low
Start the tool at the swing low and drag to the swing high.
Step 3: Read the levels
The platform marks 23.6%, 38.2%, 50%, 61.8% and 78.6% below the high.
Step 4: Keep the anchors fixed
Don't move them to fit the pullback after the fact.
In a downtrend, draw from swing high to swing low. Use significant swings, the ones you'd mark on a structure chart, not small intraday wiggles. Different anchors give different levels, which is the main source of inconsistency in Fibonacci analysis.
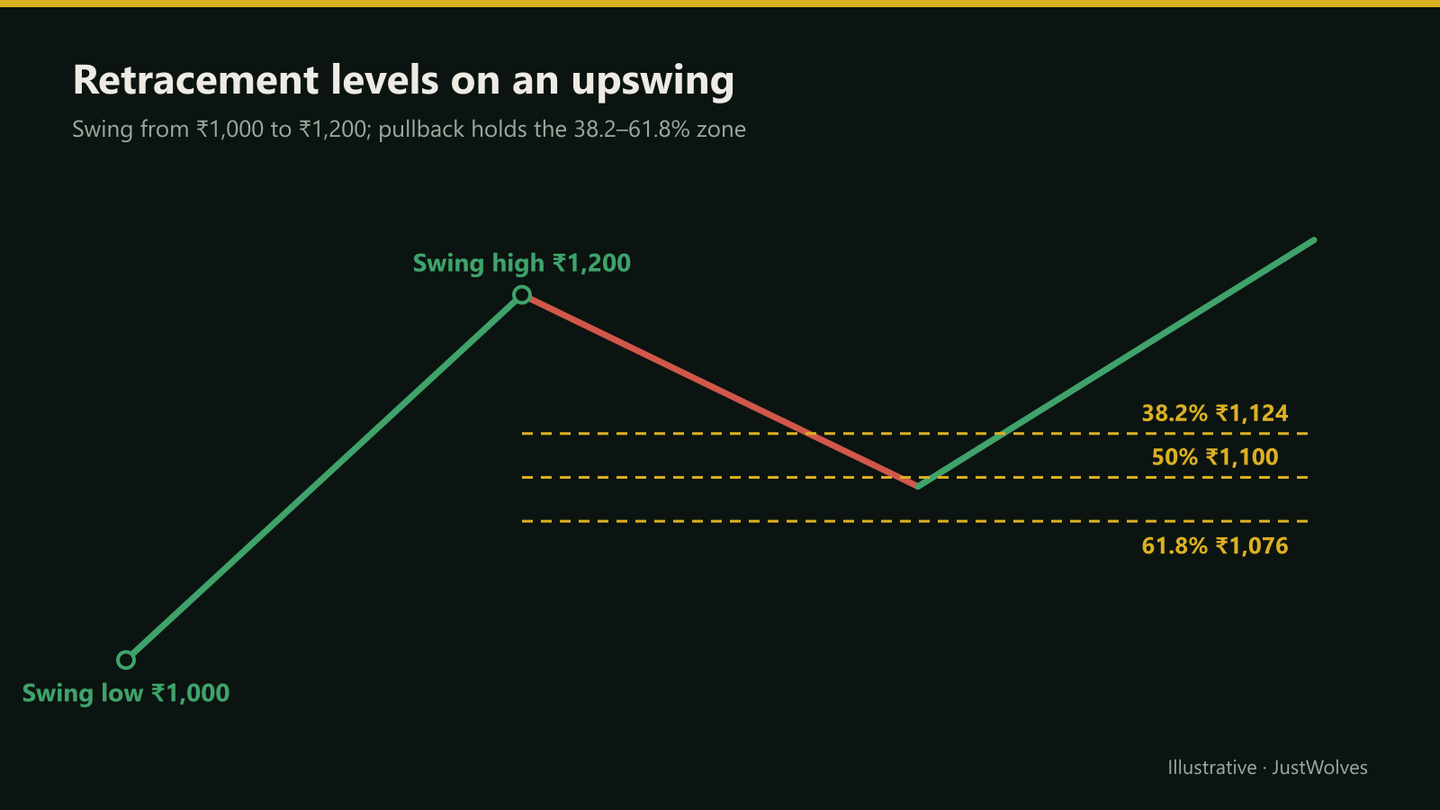
Confluence: Fibonacci Plus Structure
A Fibonacci level on its own is just a calculation. It becomes more useful when it coincides with something else on the chart: a previous resistance level that may now act as support, a rising 50-day average, the last higher low, or a gap. Traders call this agreement between independent reasons confluence.
A practical rule is to treat the 38.2–61.8% band as a zone, then look inside that zone for the structural level. The structure decides where the trade sits; Fibonacci tells you whether the pullback depth is normal for a trend.
Real Prices: A 61.8% Pullback and the Next Leg
The diagram above uses round numbers. The chart below shows one real swing that behaved like a textbook example, Maruti Suzuki in June and July 2026, with the retracement drawn on a single clear swing. The test that follows shows how often real pullbacks behaved like this.
Real prices: a 61.8% pullback and the next leg, Maruti Suzuki, June–July 2026
Step 1 of 4
The swing to measure
Maruti Suzuki rises from a closing low of ₹12,912 on 8 June 2026 to ₹13,805 on 15 June, on above-average volume. Drawn on that swing, the retracement levels are about ₹13,464 (38.2%), ₹13,359 (50%) and ₹13,253 (61.8%).
- What to observe
- One clear swing, as this lesson recommends.
- Condition
- Now wait for the pullback.
Extensions as Targets
Extensions are drawn on the same swing and projected past its end. With a swing from ₹1,000 to ₹1,200, the 127.2% extension is at about ₹1,254 and the 161.8% at about ₹1,324, measured from the swing low.
Some traders use these as places to take partial profit or tighten a trailing stop. They're reference points, not forecasts: strong trends often go well beyond 161.8%, and weak ones stall before reaching the previous high. Prior resistance levels on the weekly chart are often more reliable targets.
What the Evidence Says
There's no strong evidence that markets respect Fibonacci ratios more than other round fractions. Pullbacks in trends frequently end somewhere between a third and two-thirds of the prior swing, and the 38.2–61.8% band simply spans that common range. Because many traders watch the same levels, some reaction near them may be self-fulfilling.
That's a reasonable basis for using Fibonacci as a measuring tool and a way to organise expectations. It isn't a basis for treating 61.8% as a level that 'should' hold, or for placing stops exactly on a Fibonacci line.
Practical Example
Hypothetically, a capital goods stock rises from ₹1,000 to ₹1,200 over five weeks, breaking above a previous resistance level at ₹1,100. It then pulls back for eight sessions.
Kavya draws the retracement and notes that the 50% level (₹1,100) coincides with the old resistance, now possible support. Price reaches ₹1,095 and prints a bullish engulfing candle closing at ₹1,112. She buys at ₹1,115 with a stop at ₹1,068, below both the 61.8% level and the pullback low, risking ₹47 a share. Her first target is the previous high at ₹1,200 (₹85 above entry, about 1.8R), with the 127.2% extension at ₹1,254 as a second target.
How Deep Do Real Pullbacks Go? Our Test
This lesson's evidence section says there is no strong evidence that markets respect Fibonacci ratios more than other fractions. JustWolves measured it on about two years of daily closes (November 2024 to November 2026) for NIFTY 50 and 17 large NSE stocks. We marked swings of at least 2% on NIFTY and 4% on the stocks, and measured each pullback as a share of the upswing before it: 171 pullbacks in all. We then looked separately at the 55 pullbacks that held above the previous low and were followed by a new high, the "continuation" pullbacks swing traders want to buy.
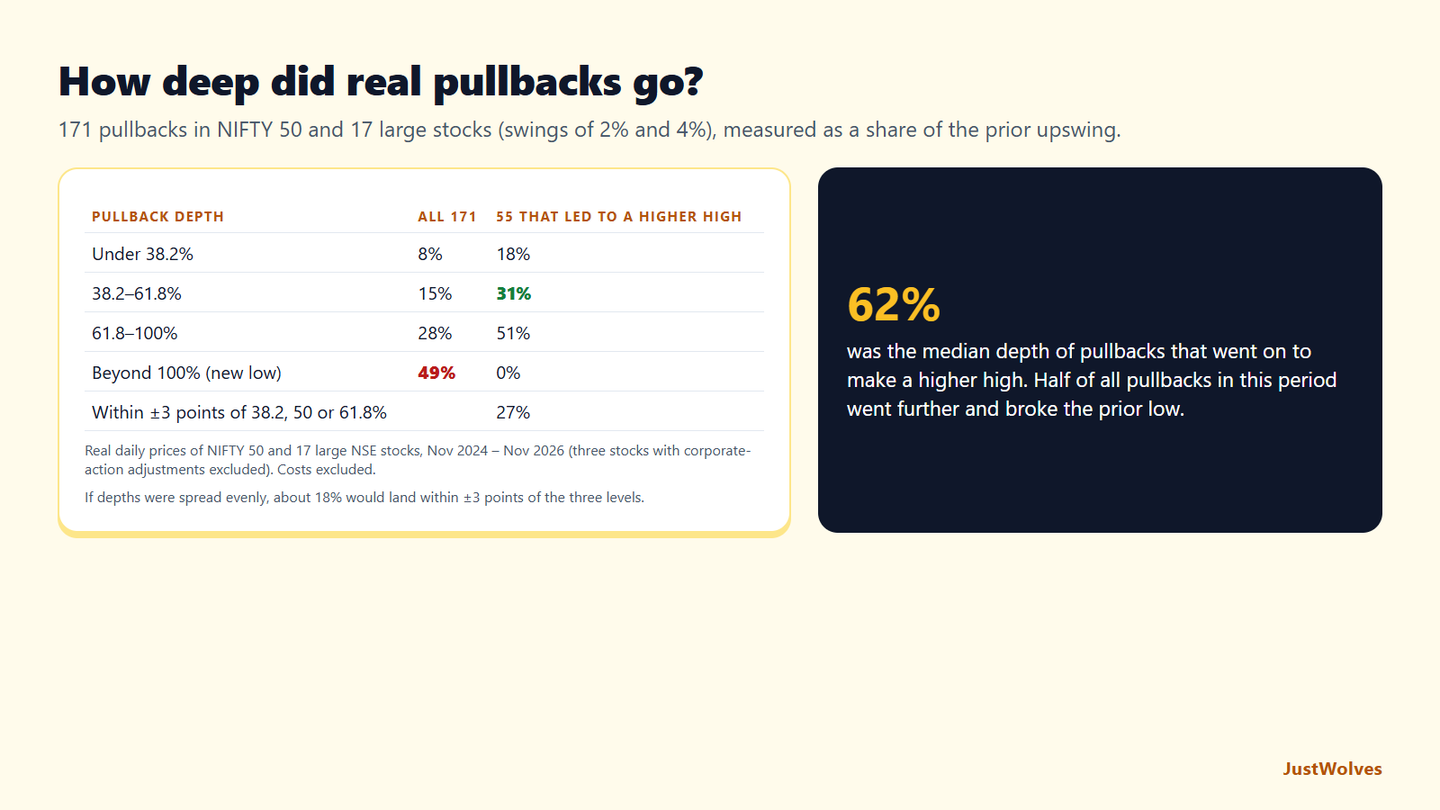
| Depth | All 171 pullbacks | 55 that led to a higher high |
|---|---|---|
| Under 38.2% | 8% | 18% |
| 38.2% to 61.8% | 15% | 31% |
| 61.8% to 100% | 28% | 51% |
| Beyond 100% (below the prior low) | 49% | 0% |
| Within ±3 points of 38.2%, 50% or 61.8% | 27% (about 18% expected by chance) |
Half of all pullbacks were not pullbacks at all: 49% went below the start of the prior upswing, turning into a new low. A Fibonacci level cannot tell you in advance which kind you are looking at. This is why this lesson insists on structure and a trigger, and why the stop belongs below the swing low rather than on a Fibonacci line.
Pullbacks that did lead to a new high were deep. Their median depth was 62%, and half went deeper than 61.8%. The 38.2–61.8% band held only about a third of them. In this period, the band was too shallow as a buying zone; the 61.8–78.6% area was at least as important, as this lesson's level table notes.
There was a slight clustering near the three classic levels: 27% of continuation pullbacks ended within three points of 38.2%, 50% or 61.8%, against about 18% if depths were spread evenly. With 55 cases, that is suggestive, not proof. It fits this lesson's conclusion: Fibonacci is a useful way to measure pullbacks and organise expectations, but the trade comes from structure, the trigger and the stop.
Common Mistakes
- Moving the anchors until the levels fit.
- Drawing from minor swings rather than significant ones.
- Buying at a level without a trigger.
- Stops exactly on a Fibonacci line, where many others place theirs.
- Treating extensions as forecasts.
Professional Insight
Experienced traders who use Fibonacci tend to use it quietly: one set of levels, drawn on the obvious swing, as a check on whether a pullback looks normal. The trade decision still comes from trend, structure and a trigger candle, and the stop still goes where the setup is proven wrong.
Risk Considerations
- Subjective anchors change the levels.
- Deep pullbacks beyond 61.8% often mean the trend is weakening.
- Self-fulfilling crowding near popular levels can cause stop runs.
Important Terminology
| Term | Meaning |
|---|---|
| Retracement | A pullback measured as a percentage of the previous swing. |
| Extension | A level projected beyond the end of a swing. |
| Anchor points | The swing low and high used to draw the levels. |
| Confluence | Several independent reasons pointing to the same level. |
| Golden zone | An informal name for the 50–61.8% area. |
Which Fibonacci level is most important?
Many swing traders watch the 38.2–61.8% zone as a whole rather than one level, and look for structure inside it.
How do I draw Fibonacci retracements?
In an uptrend, from the swing low to the swing high; in a downtrend, from the swing high to the swing low.
Do Fibonacci levels really work?
There's no strong evidence of special predictive power. They're useful as a consistent way to measure pullback depth, especially when combined with structure.
Where should I place my stop?
Beyond the level that proves the setup wrong, such as below the pullback low or the 61.8% level, not exactly on a line.
What are Fibonacci extensions used for?
As possible profit-taking areas beyond the previous high or low.
How deep is a typical pullback in an uptrend?
In our study of NIFTY 50 and 17 large NSE stocks, pullbacks that held above the previous low and led to a new high had a median depth of about 62% of the prior swing. About half were deeper than 61.8%, and only about a third ended between 38.2% and 61.8%.
Do stocks really respect Fibonacci levels?
Only slightly, in our data. Of 55 continuation pullbacks, 27% ended within three points of 38.2%, 50% or 61.8%, against about 18% expected by chance. And about half of all pullbacks broke the prior low, which no Fibonacci level predicted.
Practical Exercise
Measure real pullbacks.
Your task
Step 1: Pick five trending stocks
Daily charts over one to two years.
Step 2: Measure each pullback
Record how deep it went as a percentage of the prior swing.
Step 3: Note confluence
Was there support or a moving average near the turning point?
Step 4: Compare
Did pullbacks with confluence hold more often than those without?
Check Your Understanding
In an uptrend, retracements are drawn from:
Related Lessons
Previous: RSI and MACD for Swing Traders. Next: Multi-Timeframe Swing Analysis. See also What Is Support and Resistance? A Beginner's Guide.