
Trade Journal, Backtesting and Case Studies
JustWolves is an educational platform and is not a SEBI-registered investment advisor. Trading financial instruments involves significant risk of loss and may not be suitable for all investors. Past performance is not indicative of future results. Read our full disclaimer →
What you'll learn
- A journal turns individual trades into evidence about your setups
- Record the setup, plan, execution and outcome in R, plus notes on what you did differently from the plan
- Expectancy = win rate × average win − loss rate × average loss, all in R
- Backtests are only useful with fixed rules, enough trades and honest handling of biases
- Review weekly for execution, and monthly or quarterly for setup performance
In this article · 16 sections
Every lesson in this course ends with the same caveat: test it. This lesson explains how. A trade journal records what you actually do; a backtest estimates what a set of rules would have done; reviews connect the two. Together they're how a swing trader finds out whether a setup works for them, rather than relying on how it looks on a few well-chosen charts. The lesson ends with two case studies that show the review process.
What You Will Learn
- What to record in a swing trading journal
- Key statistics: win rate, average R and expectancy
- How to backtest manually without fooling yourself
- How to review trades, with two case studies
Before You Start
What to Record
| Stage | Fields |
|---|---|
| Before entry | Date, stock, setup type, weekly and daily trend, entry trigger, stop, target, planned R, position size, chart screenshot |
| During | Fill price, stop changes, partial exits, events such as results |
| After exit | Exit price and reason, result in rupees and R, costs, days held |
| Review | Did I follow the plan? What would I do differently? Screenshot at exit |
Recording results in R, not just rupees, makes trades comparable across different position sizes and account values.
Key Statistics
- Win rate: the percentage of trades that made money.
- Average win and average loss, in R.
- Expectancy: the average result per trade, in R. Expectancy = (win rate × average win) − (loss rate × average loss).
- Maximum drawdown: the largest fall from a peak in account value.
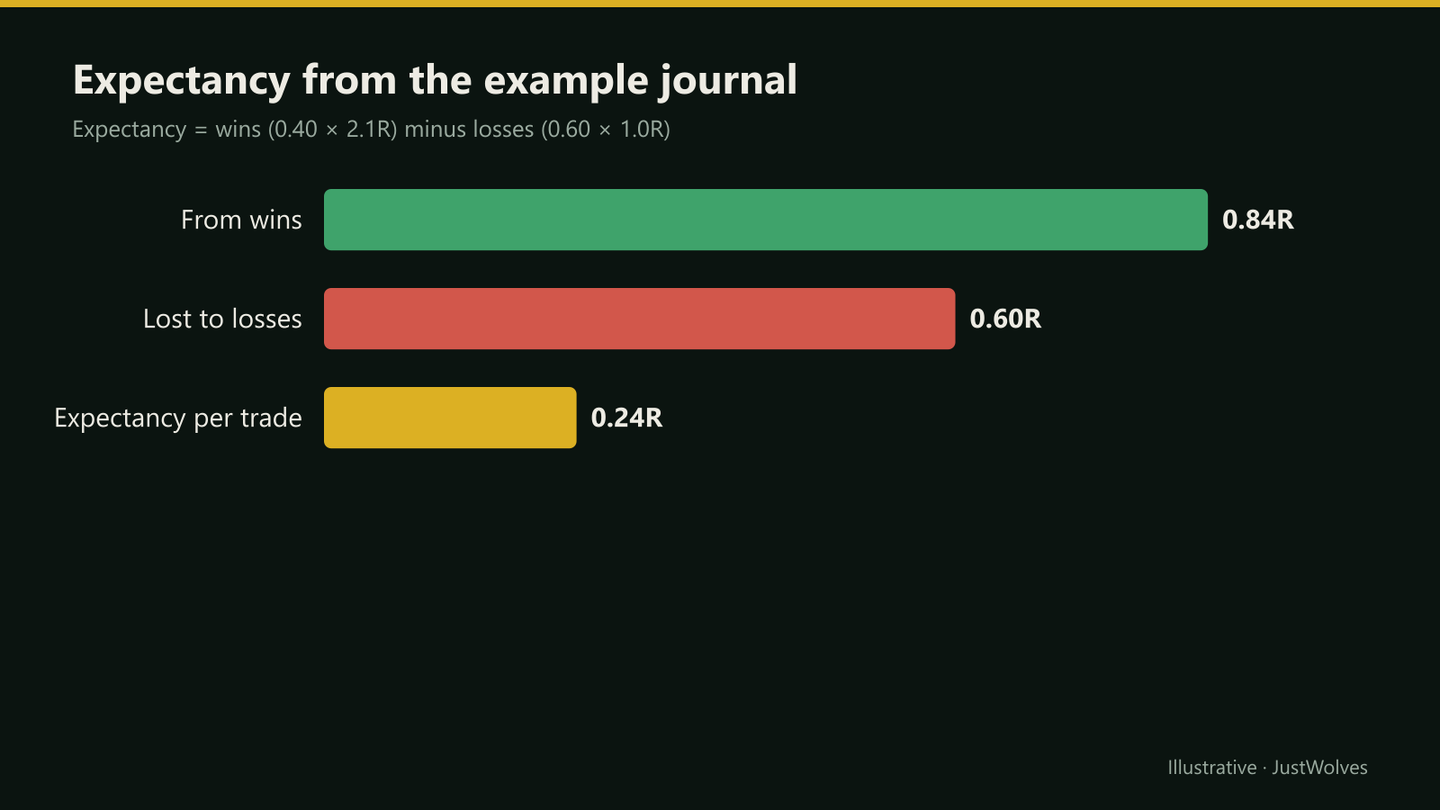
For example, 40 trades with 16 wins averaging 2.1R and 24 losses averaging 1.0R give an expectancy of (0.40 × 2.1) − (0.60 × 1.0) = 0.24R per trade. A low win rate can still be profitable if winners are large enough; a high win rate can lose money if losses are larger than wins.
Forty trades is still a small sample. Statistics from fewer than about 30–50 trades per setup can change a lot with a few more trades, so treat early numbers as provisional.
Manual Backtesting
A simple process
Step 1: Write the rules
Trend filter, setup, trigger, stop, exit, all specific enough that another person would mark the same trades.
Step 2: Choose the sample
A list of stocks and a date range decided before looking, including periods of different market conditions.
Step 3: Scroll forward
Hide the future on the chart and move one bar at a time, marking trades as the rules trigger.
Step 4: Record every trade
Including the ones that look ugly; include estimated costs.
Step 5: Forward-test
Paper-trade or trade small for several weeks before trusting the result.
Biases That Inflate Results
| Bias | What happens | Fix |
|---|---|---|
| Look-ahead bias | Using information not available at the time | Hide future bars; act only on closed candles |
| Selection bias | Testing only stocks that did well | Choose the stock list in advance |
| Survivorship bias | Ignoring stocks that were delisted or fell out of indices | Use historical index lists where possible |
| Overfitting | Tuning rules until past results look perfect | Keep rules simple; test on separate data |
| Ignoring costs | Leaving out brokerage, taxes and slippage | Deduct realistic costs per trade |
Reviewing Trades
A weekly review checks execution: did each trade follow the plan? Mark trades as 'plan followed' or 'plan broken', regardless of outcome. A losing trade that followed the plan is a good trade; a winning trade that broke it is a warning.
A monthly or quarterly review checks the setups: expectancy by setup type, by market condition, and by exit method. This is where you decide whether to keep, change or drop a setup, based on enough trades to mean something.
Case Study 1: A Losing Trade Done Right
Hypothetically, Shreya takes a pullback setup in a weekly uptrend: entry ₹1,150, stop ₹1,118, target ₹1,215. Two days later, the market falls sharply and the stock closes below the pullback low. Her stop fills at ₹1,116, a loss of about 1.06R including slippage.
Her review: setup valid, trigger valid, stop correctly placed, size within limits, no results due. Verdict: plan followed. No change needed; losses like this are part of the setup's expected results.
Real Prices: Case Study 1 on a Real Chart
Shreya's first case study is hypothetical. The chart below shows the same kind of trade on real Axis Bank prices from May and June 2025: a valid pullback, a planned stop, a clean 1R loss, and a rebound the next day that tests the trader's judgement.
Real prices: a losing trade done right, Axis Bank, May–June 2025
Step 1 of 4
The plan
In May 2025 Axis Bank trades well above a rising 50-day average. It pulls back to ₹1,177.5 near its 20-day EMA, and on 23 May closes at ₹1,210.1, above the previous day's high. The journal entry: setup pullback; entry ₹1,210.1; stop ₹1,166.1 (half an ATR below the low); target 2R at ₹1,298.1; risk 1%; no results due.
- What to observe
- Everything recorded before the outcome is known.
- Condition
- This is Shreya's first case study, on a real chart.
Case Study 2: A Winning Trade Done Wrong
Hypothetically, Shreya buys a breakout without waiting for the daily close, entering at ₹640 with a stop at ₹622. She also holds through results she hadn't checked. The stock gaps up and she exits at ₹700, a gain of about 3.3R.
Her review: entry broke the trigger rule; results calendar not checked; position held through an unplanned event. Verdict: plan broken, despite the profit. She notes that the same decisions, repeated, would eventually produce a gap loss, and adds a pre-entry checklist item for the results date.
How Misleading Is a Small Sample? Our Test
This lesson warns that statistics from fewer than about 30–50 trades can change a lot. JustWolves measured how much, using the 379 simulated pullback trades from this module on about two years of daily prices for 17 large NSE stocks (November 2024 to November 2026). We put the trades in date order and cut them into overlapping blocks of 30 consecutive trades, each one the kind of record a trader might keep in a few months, and calculated the expectancy of each block.
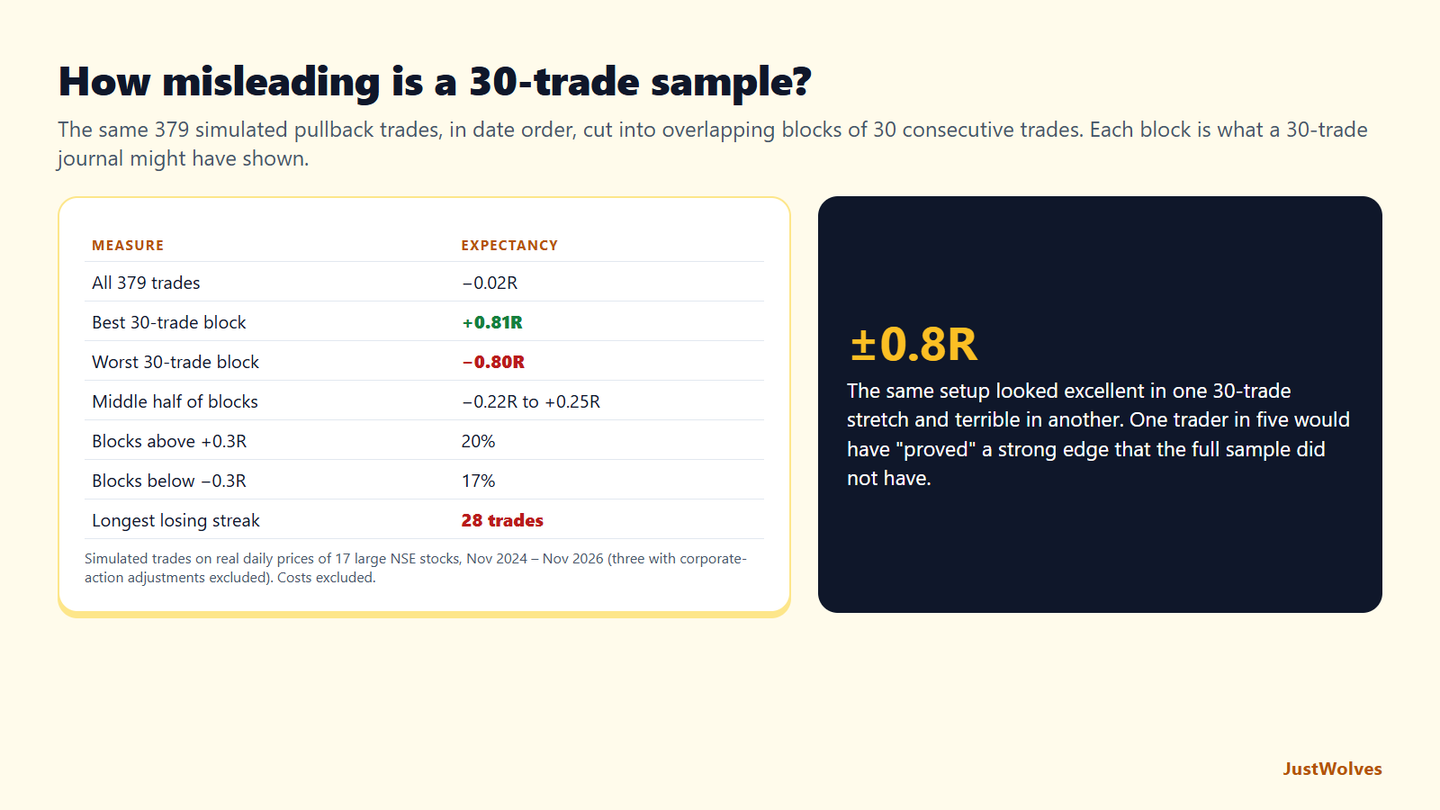
| Measure | Expectancy |
|---|---|
| All 379 trades | −0.02R |
| Best 30-trade block | +0.81R |
| Worst 30-trade block | −0.80R |
| Middle half of blocks | −0.22R to +0.25R |
| Blocks above +0.3R | 20% of blocks |
| Blocks below −0.3R | 17% of blocks |
| Longest losing streak (all trades) | 28 trades |
Thirty trades were nowhere near enough. The same setup, with an expectancy close to zero over 379 trades, showed +0.81R in its best 30-trade stretch and −0.80R in its worst. One block in five would have convinced a trader they had a strong edge; one in six that the setup was hopeless. Neither was true. This is exactly the small-sample warning in this lesson's statistics section, and the reason the monthly review should look at setups only after enough trades.
Streaks were long. Because trades cluster in time and the market moves them together, there was a run of 28 consecutive losing trades in the sample. A trader judging by recent results would almost certainly have abandoned or changed the setup during that run, or, in a lucky run, increased size just before the bad one.
The practical rules follow from this lesson: record every trade in R, mark each one "plan followed" or "plan broken" so execution is judged separately from outcome, and only draw conclusions about a setup once you have a large sample, ideally across different market conditions. A backtest helps by giving you that sample before you risk money, as long as it avoids the biases in this lesson's table.
Common Mistakes
- Recording only rupee results, not R.
- Judging trades by outcome instead of plan adherence.
- Drawing conclusions from small samples.
- Backtesting with hindsight.
- Skipping reviews when results are good.
Professional Insight
Many experienced traders say their journal is their real edge: it's where they discovered which setups, conditions and exit rules actually worked for them, and which habits cost them money. The traders who improve fastest tend to be the ones who review consistently, especially after good months, when it's tempting to stop looking.
Risk Considerations
- Backtests overstate results when biases creep in.
- Past results don't guarantee future performance.
- Small samples can mislead in either direction.
Important Terminology
| Term | Meaning |
|---|---|
| Expectancy | Average result per trade, in R. |
| Win rate | Percentage of profitable trades. |
| Drawdown | A fall from a peak in account value. |
| Look-ahead bias | Using information that wasn't available at the time. |
| Forward test | Trading rules live, on paper or small size, after a backtest. |
What should a swing trading journal include?
Setup, trend, entry, stop, target, size, result in R, costs, screenshots and whether you followed the plan.
How do I calculate expectancy?
Expectancy = (win rate × average win) − (loss rate × average loss), with wins and losses in R.
How many trades do I need to judge a setup?
Many traders look for at least 30–50 trades per setup before drawing firm conclusions.
Can I backtest swing strategies manually?
Yes, by scrolling charts forward one bar at a time with fixed rules and recording every trade.
What is look-ahead bias?
Using information in a backtest that wouldn't have been available when the trade was taken.
Is 30 trades enough to judge a trading setup?
Rarely. In our test of 379 simulated swing trades on NSE stocks, consecutive 30-trade samples of the same setup showed expectancies anywhere from −0.80R to +0.81R, while the full sample was about 0R. Use larger samples and several market conditions.
How long can a losing streak last with a normal setup?
Much longer than most traders expect. In our 379-trade simulation of a swing pullback setup on 17 NSE stocks, the longest run of consecutive losing trades was 28, because trades taken at the same time tend to fail together in sell-offs.
Practical Exercise
Start your journal and backtest.
Your task
Step 1: Set up the journal
A spreadsheet with the fields in this lesson.
Step 2: Backtest one setup
Fifty trades with fixed rules, across at least ten stocks.
Step 3: Calculate statistics
Win rate, average R and expectancy, after costs.
Step 4: Forward-test
Paper-trade the same rules for a month and compare.
Check Your Understanding
Win rate 40%, average win 2.1R, average loss 1R. Expectancy:
Related Lessons
Previous: Swing Position Sizing and Portfolio Heat. This completes the Swing Trading course. See also How to Keep a Trading Journal and How to Backtest a Trading Strategy.