
What Is Swing Trading? A Guide for Indian Markets
JustWolves is an educational platform and is not a SEBI-registered investment advisor. Trading financial instruments involves significant risk of loss and may not be suitable for all investors. Past performance is not indicative of future results. Read our full disclaimer →
What you'll learn
- Swing trading aims to capture one leg of a price move, usually over a few days to a few weeks
- It sits between day trading (minutes to hours) and investing (months to years)
- In India, swing trades are commonly taken in delivery shares, and sometimes in futures or options
- Positions are held overnight, so gap risk and position sizing matter
- There are no guaranteed returns; results depend on a tested plan, risk control and discipline
In this article · 16 sections
Swing trading tries to capture a single 'swing' in price: the move from a pullback low to the next high in an uptrend, or from a rally high to the next low in a downtrend. Trades usually last from a few days to a few weeks, which makes swing trading popular with people who can't watch markets all day. This first lesson of the course explains what swing trading is, how it's done in Indian markets, and what to expect from it.
What You Will Learn
- What swing trading is and its typical holding periods
- How it compares with day trading and investing
- Instruments used for swing trading in India
- Realistic expectations and the main risks
Before You Start
Swing trading builds on price action. If you haven't already, read What Is Price Action Trading? and Market Trends.
What Swing Trading Is
Markets rarely move in straight lines. Even in a strong uptrend, price advances in legs separated by pullbacks. Swing traders aim to enter near the start of a leg and exit near its end, holding positions for as long as the move lasts, typically from about three days to a few weeks.
Most swing trading is based on daily charts, with weekly charts for context and sometimes 1-hour charts for entry timing.
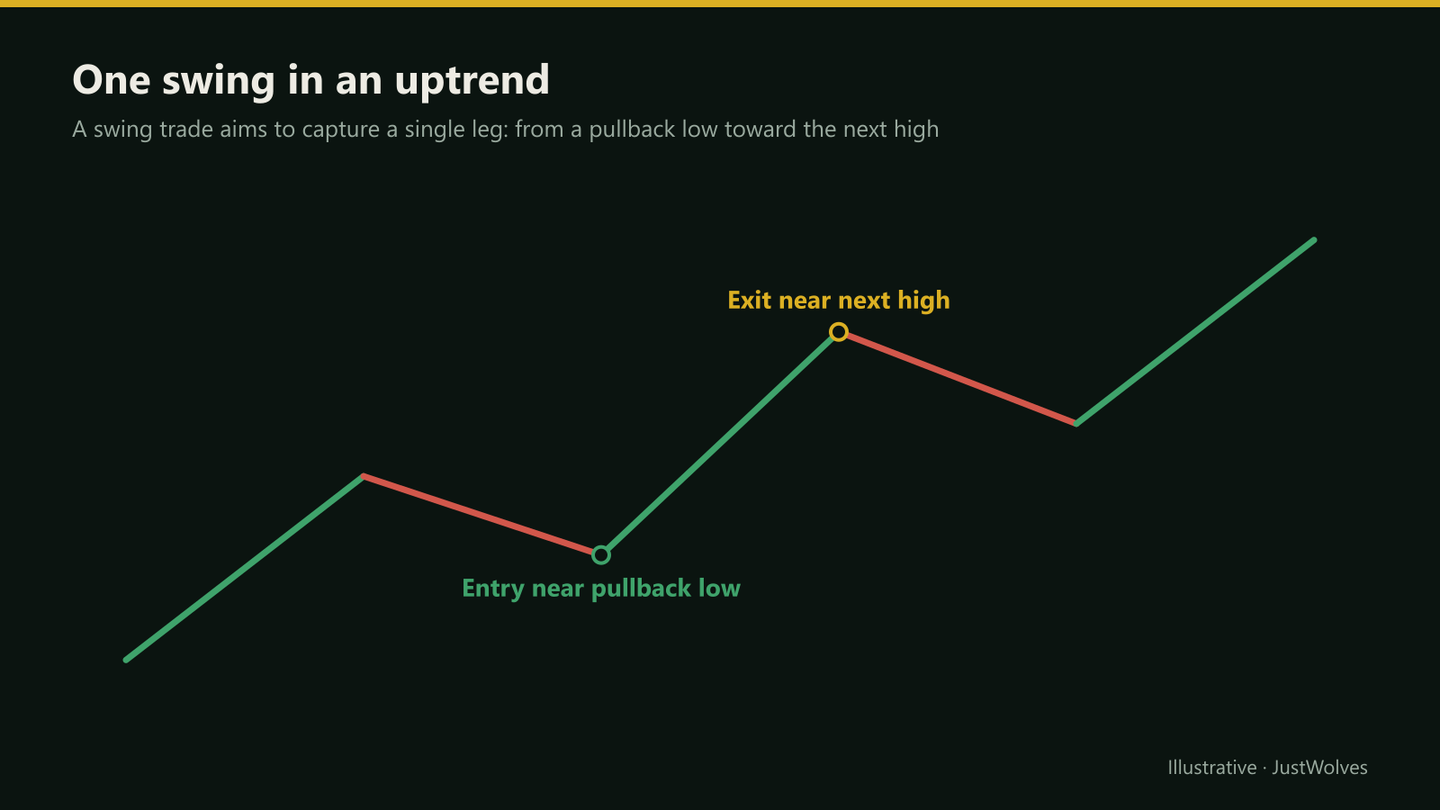
Real Prices: One Swing, Start to Finish
The diagram above is schematic. The chart below shows the same idea on real prices: a pullback and the next leg up in Tata Steel in June and July 2025, with an entry, stop and target set in the way this lesson's example describes.
Real prices: one swing in Tata Steel, June–July 2025
Step 1 of 4
A pullback in an uptrend
In early June 2025 Tata Steel is in a daily uptrend, trading near ₹158 above a rising 50-day average around ₹149. Over two weeks it pulls back to about ₹151, with RSI near 41 and volume below average.
- What to observe
- Price falls, but the trend structure holds.
- Condition
- A swing trader waits for buyers to return.
How It Compares
| Day trading | Swing trading | Investing | |
|---|---|---|---|
| Holding period | Minutes to hours | Days to weeks | Months to years |
| Main charts | Intraday | Daily, weekly | Weekly, monthly, fundamentals |
| Screen time | High, during market hours | Moderate, often after the close | Low |
| Overnight risk | None (positions closed) | Yes | Yes, but long horizon |
| Main analysis | Technical | Mostly technical, some fundamental | Mostly fundamental |
Instruments in India
- Delivery (cash) shares: the most common choice. No expiry and no leverage by default, so a position can be held through normal pullbacks.
- Stock and index futures: leveraged, with daily mark-to-market and monthly expiry; suit experienced traders with strict sizing.
- Options: can define risk, but time decay works against bought options held for weeks.
- ETFs: index or sector ETFs for broader swing views.
Technical and Fundamental Analysis
Most swing trading uses technical analysis: trends, support and resistance, patterns and a few indicators. For holding periods of several weeks, some traders add a fundamental filter, such as preferring companies with improving earnings, and avoid holding through results announcements.
A practical rule for beginners: use technicals for timing and a basic fundamental or news check to avoid obvious event risk.
Realistic Expectations
Swing trading involves frequent small losses, occasional larger gains and long flat periods. There's no reliable monthly return, and claims of consistent high returns should be treated with scepticism.
What a swing trader can control is the process: a written plan, a fixed risk per trade, and honest records. The Risk Management course covers those foundations.
A Typical Week
A part-time swing trader's week might look like this: an hour at the weekend reviewing index and sector trends and building a watchlist; twenty to thirty minutes each evening checking setups, alerts and open positions; and order placement before the market opens. Most of the work happens outside market hours, which is a large part of the style's appeal.
Practical Example
Hypothetically, Asha has a full-time job and checks charts after 6 pm. She notices a large-cap stock in a daily uptrend pulling back to ₹1,480, near its 50-day moving average and a previous breakout level.
She places a buy order for the next morning at ₹1,490 with a stop at ₹1,445 and a target at the recent high of ₹1,590. Eight trading days later, the stock reaches ₹1,585 and her order to sell at ₹1,585 fills: a gain of ₹95 per share on ₹45 of risk.
How Long Does a Real Swing Last? Our Data
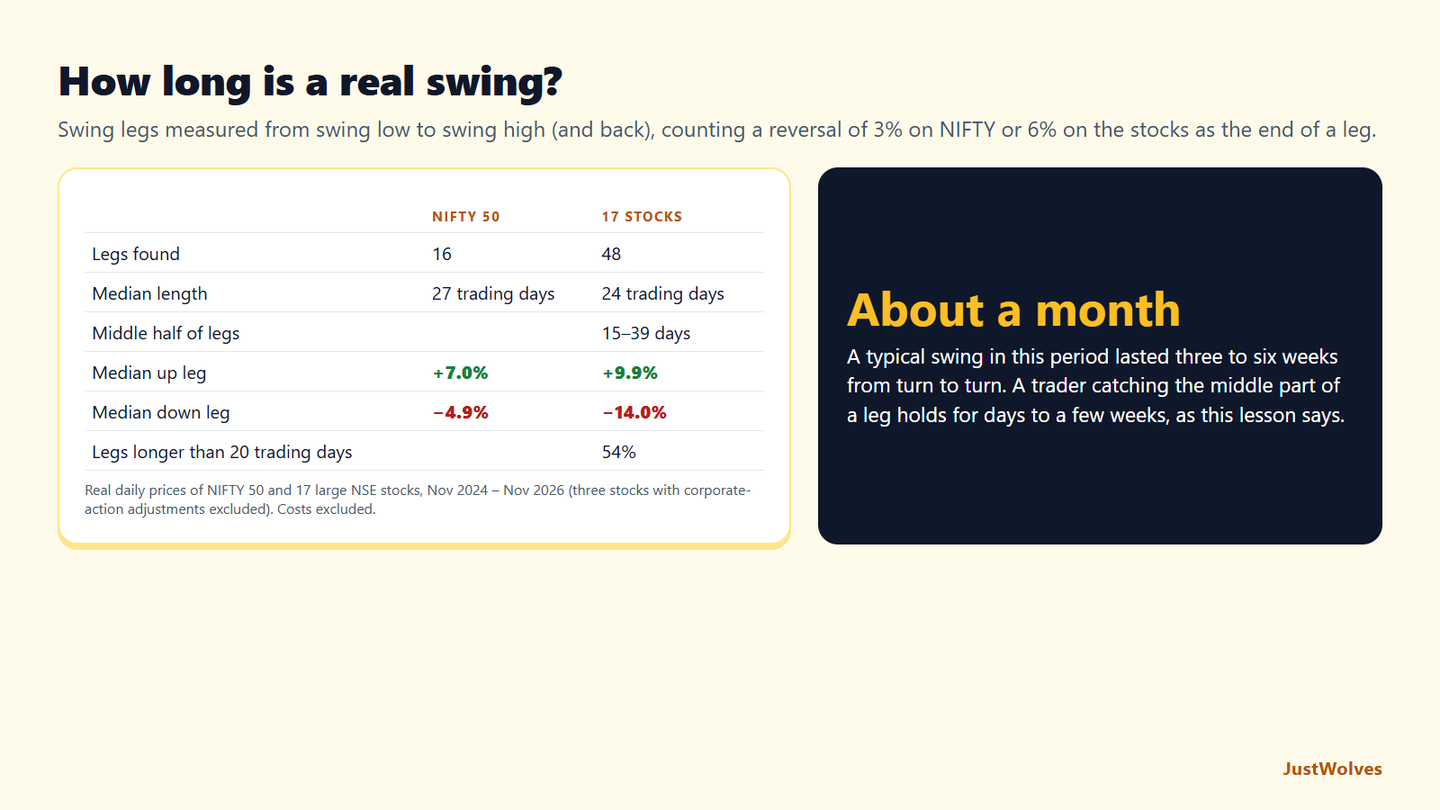
This lesson says swing trades usually last from a few days to a few weeks. JustWolves measured real swings to see where that comes from. We took about two years of daily closes (November 2024 to November 2026) for NIFTY 50 and 17 large NSE stocks, and marked a leg as finished when price reversed by 3% for NIFTY or 6% for a stock. Three stocks with corporate-action price adjustments were left out.
| NIFTY 50 (3% reversal) | 17 stocks (6% reversal) | |
|---|---|---|
| Legs found | 16 | 48 |
| Median length, turn to turn | 27 trading days | 24 trading days |
| Middle half of legs | 15–39 trading days | |
| Median up leg | +7.0% | +9.9% |
| Median down leg | −4.9% | −14.0% |
A full swing took about a month. From one turning point to the next, the median stock leg lasted 24 trading days and NIFTY's 27, and the middle half of stock legs lasted between three and eight weeks. A swing trader who enters after a pullback has been confirmed and exits before the next one is usually in the trade for a part of that: days to a few weeks, as this lesson says. The chart above was a fast example, with the target reached in three days.
Legs were large enough to matter, and so were the falls. The median rising leg on a stock was about 10%; the median falling leg, in a period that included two sharp market falls, was about 14%. A swing trader's stop has to sit outside the normal noise of a leg, but well inside a move of that size.
These figures depend on the period and on the 6% threshold; a tighter threshold finds more, shorter swings. What they support is this lesson's realistic-expectations section: swing trading is about catching part of a move that takes weeks to unfold, not about daily income.
Common Mistakes
- Turning swing trades into investments when they go wrong.
- Ignoring overnight and gap risk.
- Using leverage before the strategy is tested.
- Holding through results without a plan.
- Expecting steady monthly income.
Professional Insight
Many experienced swing traders treat their approach as a business process: a weekly routine for scanning and planning, fixed rules for entries and exits, and a journal reviewed every month. The consistency of the process matters more than any single trade.
Risk Considerations
- Gaps can move prices past stops overnight.
- Leverage in futures magnifies losses.
- Concentration in one sector increases correlated risk.
Important Terminology
| Term | Meaning |
|---|---|
| Swing | One leg of a price move between a low and a high. |
| Holding period | How long a position is kept open. |
| Delivery trade | Buying shares to hold in your demat account. |
| Gap | A price jump between one session's close and the next open. |
| Pullback | A temporary move against the trend. |
What is swing trading?
A style of trading that aims to capture one leg of a price move, holding positions for a few days to a few weeks.
Is swing trading good for people with jobs?
It can suit people with limited screen time, since analysis can be done after market hours.
How long do swing trades last?
Typically from about three days to a few weeks.
Can I swing trade with futures and options?
Yes, but leverage and time decay add risk; many traders start with delivery shares.
How much can I earn from swing trading?
There's no reliable figure; results vary widely and losses are common, especially early on.
How long does a swing usually last in Indian stocks?
In our two-year study of 17 large NSE stocks, the median swing from one 6% turning point to the next lasted about 24 trading days, with the middle half lasting 15 to 39 days. A swing trade usually captures part of that, often a few days to a few weeks.
How big is a typical swing move?
In our data, the median rising leg on a large NSE stock was about +10% and the median falling leg about −14%, in a period with two sharp market falls. On NIFTY 50 the median rising leg was about +7%.
Practical Exercise
Spot swings on a chart.
Your task
Step 1: Open a daily chart
A liquid large-cap stock or Nifty.
Step 2: Mark swings
Every pullback low and the next high over six months.
Step 3: Measure
Typical length in days and size in percent of each up-leg.
Step 4: Reflect
How much of each leg could a realistic entry and exit have captured?
Check Your Understanding
Swing trading typically holds positions for:
Related Lessons
Next: Swing Trading vs Day Trading. See also Risk Management Basics.