
Implied Volatility vs Historical Volatility
JustWolves is an educational platform and is not a SEBI-registered investment advisor. Trading financial instruments involves significant risk of loss and may not be suitable for all investors. Past performance is not indicative of future results. Read our full disclaimer →
What you'll learn
- Historical volatility (HV) measures how much the underlying has actually moved; implied volatility (IV) is what option prices expect
- Both are usually quoted as annualised percentages
- Dividing annual volatility by about 16 (the square root of 252 trading days) gives a rough one-day expected move
- India VIX is NSE's measure of expected 30-day Nifty volatility, derived from Nifty option prices
- IV tends to rise before known events and fall after them
In this article · 15 sections
Volatility is the one option-pricing input nobody knows in advance. Traders work with two versions of it: historical volatility, what the underlying has actually done, and implied volatility, what option prices say the market expects. Comparing the two is one of the most useful habits in options trading. This lesson explains both, how India VIX fits in, and how to turn a volatility number into an expected price move.
What You Will Learn
- What historical and implied volatility measure
- How to convert volatility into an expected move
- What India VIX is
- How IV behaves around events
Before You Start
Read Option Pricing Basics first.
Historical Volatility
Historical volatility (HV), also called realised volatility, measures how much the underlying's price has actually fluctuated over a past period, such as the last 20 or 30 trading days.
It's calculated as the standard deviation of daily percentage returns, then annualised by multiplying by the square root of the number of trading days in a year (about √252 ≈ 15.9). A stock that typically moves about 1% a day has an annualised HV of roughly 16%.
Implied Volatility
Implied volatility (IV) is the volatility that, plugged into a pricing model, produces the option's current market price. It's forward-looking: the market's collective estimate of how much the underlying will move until expiry.
IV is shown for each strike on most option chains. It's quoted on the same annualised basis as HV, so the two can be compared directly.
| Historical volatility | Implied volatility | |
|---|---|---|
| Looks | Backward at actual moves | Forward at expected moves |
| Source | Past prices of the underlying | Current option prices |
| Changes when | New price data arrives | Option demand and supply change |
| Main use | What 'normal' movement looks like | Whether options are cheap or expensive |
Turning Volatility into an Expected Move
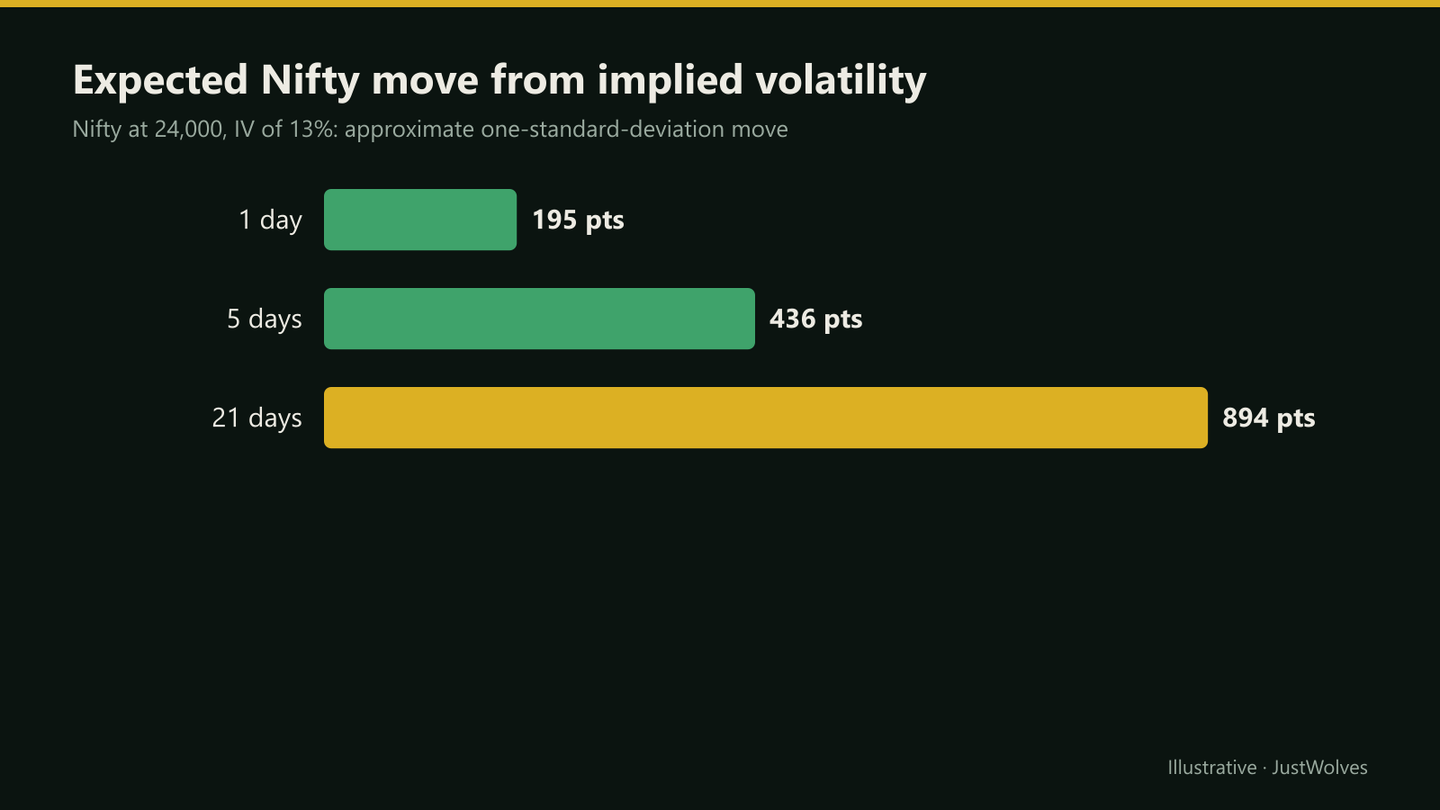
A rough rule: one-day expected move ≈ price × annual volatility ÷ 16. For a longer period, multiply the daily figure by the square root of the number of trading days.
With Nifty at 24,000 and IV of 13%, the one-day expected move is about 24,000 × 0.13 ÷ 16 ≈ 195 points. Over five trading days, about 195 × √5 ≈ 436 points. In statistical terms, that's a one-standard-deviation range, which the market treats as likely but by no means certain.
Real Data: Two Moves Far Beyond the Expected Move
The chart below uses real daily NIFTY 50 prices from January and February 2026. Step through it to see what this lesson's expected-move rule said before two sharp moves, and how far reality exceeded it.
Real data: two moves far beyond the "expected move", NIFTY, January–February 2026
Step 1 of 4
A calm market
In mid-January 2026 NIFTY drifts between about 25,500 and 25,900. Its 20-day realised volatility is about 7.5%, which implies a one-day expected move of only about 122 points (25,586 × 0.075 ÷ 16).
- What to observe
- Low volatility, small expected moves.
- Condition
- Options priced from recent movement would be cheap.
India VIX
India VIX is a volatility index published by NSE. It's calculated from the prices of near- and next-month Nifty options and expresses the market's expected volatility of the Nifty over the next 30 calendar days, as an annualised percentage.
A rising India VIX means options are getting more expensive because the market expects bigger moves; a falling VIX means the opposite. It often rises sharply during market sell-offs.
Comparing IV and HV
- IV well above HV: options are pricing bigger moves than recently seen. That may be justified by an upcoming event, or it may mean options are expensive.
- IV well below HV: options are pricing smaller moves than recently seen, which may make buying options relatively attractive.
- Neither condition is a signal on its own. They're context for choosing between buying and selling strategies.
Practical Example
Hypothetically, a bank stock at ₹1,600 has 20-day HV of 22%. Two days before its quarterly results, the ATM option's IV is 38%. Rajesh calculates that 38% implies a one-day move of about 1,600 × 0.38 ÷ 16 ≈ ₹38.
He expects the result to move the stock only about ₹20, so he decides buying options ahead of the announcement is expensive. After the results, the stock moves ₹24 and IV falls to 24%. A trader who had bought the ATM call would likely have lost money despite the stock rising.
How Often Do Real Moves Exceed the Expected Move? Our Data
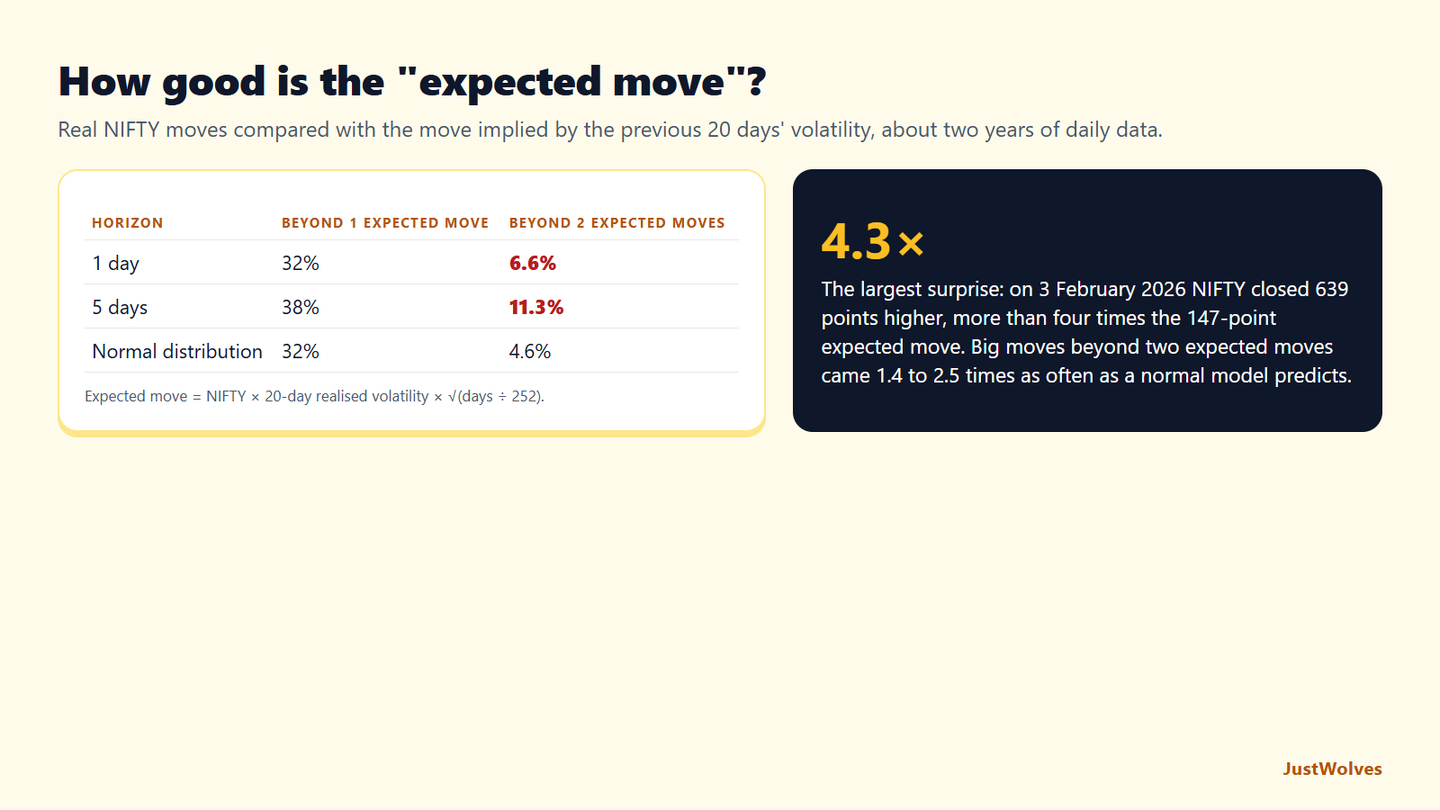
This lesson's risk considerations say that large moves exceed one standard deviation more often than simple models suggest. JustWolves tested that on about two years of real NIFTY 50 data (November 2024 to November 2026). Our dataset does not include historical implied volatility or India VIX, so we used the volatility traders can always calculate: the previous 20 days' realised volatility, turned into an expected move with this lesson's rule (price × volatility ÷ 16, scaled by the square root of the number of days).
| Horizon | Beyond one expected move | Beyond two expected moves |
|---|---|---|
| One day | 32% | 6.6% |
| Five days | 38% | 11.3% |
| A normal distribution | 32% | 4.6% |
Two findings matter for option traders. For ordinary days, the rule worked well: one-day moves exceeded one expected move 32% of the time, exactly what the normal model predicts. For large moves, it understated the risk: moves beyond two expected moves happened 6.6% of the time over one day and 11.3% over five days, between 1.4 and 2.5 times as often as the normal model predicts. Several were three to four times the expected move, such as 12 May 2025 (4.1×) and 3 February 2026 (4.3×).
Part of the reason is visible in the chart above: volatility clusters, so a calm 20-day window can be followed by a sudden jump, and the expected move calculated from the calm period is too small. Implied volatility, which looks forward, often anticipates scheduled events but cannot anticipate surprises. For buyers, that means cheap options in quiet markets occasionally pay off very well; for sellers, it means the rare large move is the main risk, and it is less rare than the textbook normal curve suggests.
Common Mistakes
- Buying options just before events without checking IV.
- Treating high IV as a sell signal on its own.
- Comparing IV across very different expiries without adjusting.
- Reading India VIX as a direction indicator.
- Forgetting that expected moves are ranges, not forecasts.
Professional Insight
Many professional options traders keep a record of each underlying's typical IV range. They look for options to buy when IV is near the low end of its own history and sell when it's near the high end, adjusting for upcoming events.
Risk Considerations
- Volatility can stay high or low longer than expected.
- Large moves exceed one standard deviation more often than simple models suggest.
- IV can spike suddenly in a market shock.
Important Terminology
| Term | Meaning |
|---|---|
| Historical volatility | Annualised volatility of past price moves. |
| Implied volatility | Volatility implied by current option prices. |
| India VIX | NSE's index of expected 30-day Nifty volatility. |
| Expected move | A one-standard-deviation range derived from volatility. |
| Volatility crush | A sharp fall in IV after an event. |
What is implied volatility?
The volatility implied by an option's market price: the market's estimate of how much the underlying will move.
What is India VIX?
NSE's volatility index, measuring the market's expected 30-day volatility of the Nifty from Nifty option prices.
Is high implied volatility good or bad?
It makes options expensive. That can favour selling strategies, but high IV often reflects real risk, such as an upcoming event.
How do I calculate an expected move?
Roughly, price × annual volatility ÷ 16 for one day, scaled by the square root of the number of days.
Why does IV fall after results?
The uncertainty is resolved, so the market no longer pays as much for protection against a big move.
Does high volatility mean the market will fall?
Not by itself. High volatility means larger moves are expected or have happened, in either direction. India VIX often rises during sell-offs, but volatility measures the size of moves, not their direction.
How often does NIFTY move more than its expected move?
In our two years of real data, using the previous 20 days' realised volatility, one-day moves exceeded one expected move 32% of the time, as the normal model predicts, but exceeded two expected moves 6.6% of the time, against 4.6% expected. Over five days the excess was larger: 11.3%.
Practical Exercise
Track IV around an event.
Your task
Step 1: Pick a stock
With quarterly results due within two weeks.
Step 2: Record daily
ATM IV and the stock's 20-day HV.
Step 3: Calculate
The expected move implied by IV the day before results.
Step 4: Compare
The actual move, and IV the day after.
Check Your Understanding
Implied volatility comes from:
Related Lessons
Previous: Option Pricing Basics. Next: Option Greeks: Delta and Gamma.