
F&O Risk Management: Sizing, Limits and Rules
JustWolves is an educational platform and is not a SEBI-registered investment advisor. Trading financial instruments involves significant risk of loss and may not be suitable for all investors. Past performance is not indicative of future results. Read our full disclaimer →
What you'll learn
- Size every F&O position from its rupee risk, not from the number of lots or the margin available
- Keep a large margin buffer so normal swings never force a sale
- Prefer defined-risk structures (bought options, spreads) while learning
- Set daily and weekly loss limits, and stop trading when they're hit
- Have explicit rules for events, expiry days and stock F&O near expiry
In this article · 16 sections
Derivatives magnify everything, including mistakes. The final lesson of the course pulls together the risk rules that matter most for futures and options: how to size positions, how much margin to keep spare, which structures limit damage, and the personal limits that keep one bad day from becoming a disaster. It builds on the [Risk Management](/learn/risk-management) course, applied specifically to F&O.
What You Will Learn
- How to size futures and options positions
- Margin buffers and leverage
- Defined-risk structures
- Loss limits and an F&O risk checklist
Before You Start
Read NSE Contract Rules and SEBI F&O Regulations, and from the Risk Management course, Position Sizing and Daily Loss Limit.
Size from Rupee Risk
| Position | Risk per lot |
|---|---|
| Futures with a stop | Stop distance (points) × lot size |
| Bought option, no stop | Full premium × lot size |
| Bought option with a premium stop | (Entry premium − stop premium) × lot size, plus gap risk |
| Debit spread | Net debit × lot size |
| Short option | Potentially very large; stops can be skipped by gaps |
Then: lots = risk per trade ÷ risk per lot, rounded down. If the answer is less than one, the trade is too big for the account; skip it or use a smaller-risk structure.
Margin Buffers
Using all the margin your broker allows is the most common way small F&O accounts blow up. Margins can rise in volatile markets and MTM losses reduce available funds, forcing exits at the worst time.
A conservative habit is to keep total margin used well below your account value, for example under half, so that normal swings and margin increases never trigger forced closures.
Prefer Defined Risk While Learning
Bought options and debit spreads have a maximum loss known at entry. Futures and short options don't. While you're learning, defined-risk structures make it impossible for a single position to cost more than you planned, even if a stop is skipped by a gap.
Real Prices: A Gap Through a Futures Stop
This lesson says defined-risk structures make it impossible for one position to cost more than planned, "even if a stop is skipped by a gap". The chart below shows what that looks like on real NIFTY 50 prices from early February 2026, the largest opening gap in our two years of data.
Real NIFTY prices: a gap through a futures stop, January–February 2026
Step 1 of 4
A sharp gap down
After a week between about 24,930 and 25,460, NIFTY opens on 2 February 2026 at 24,797, more than 500 points below the previous close, then recovers to close at 25,088.
- What to observe
- A volatile session; direction unclear.
- Condition
- A trader decides to short.
Personal Limits
- Risk per trade: commonly 0.5–2% of the account.
- Daily loss limit: stop trading for the day after losing, say, 2–3%.
- Weekly loss limit: pause and review after a larger drawdown.
- Maximum open risk: the total that all open positions could lose together.
Event, Expiry and Settlement Rules
- Events: reduce size or stay flat before results, policy announcements and budget days, unless the strategy is designed for them.
- Expiry day: decide in advance whether you trade it; if you do, use small sizes and fixed exits.
- Stock F&O: close or roll before expiry unless you've planned for physical settlement.
- Ban list: check before trading stock derivatives.
Watch Correlated Positions
Several positions can quietly add up to one large bet. A long Nifty futures lot, a Bank Nifty call spread and a few bank stock options all gain and lose together on a broad market move. Counted separately, each may fit your risk per trade; counted together, they can exceed your maximum open risk.
Before adding a position, ask how it would behave in a sharp market fall alongside what you already hold. The Correlation Risk lesson covers this in more detail.
Practical Example
Hypothetically, Shruti has ₹6,00,000 and risks 1% (₹6,000) per trade. A Nifty futures setup has a stop 120 points away: risk per lot is 120 × 65 = ₹7,800, more than her limit, so she skips futures.
Instead she considers a bull call spread with a net debit of ₹90: risk per lot is 90 × 65 = ₹5,850, within her limit. She takes one lot, keeps her total margin used well under half her account, and has a daily loss limit of ₹15,000 (2.5%).
What Do Sizing, Gaps and Correlation Look Like in Real Data? Our Tests
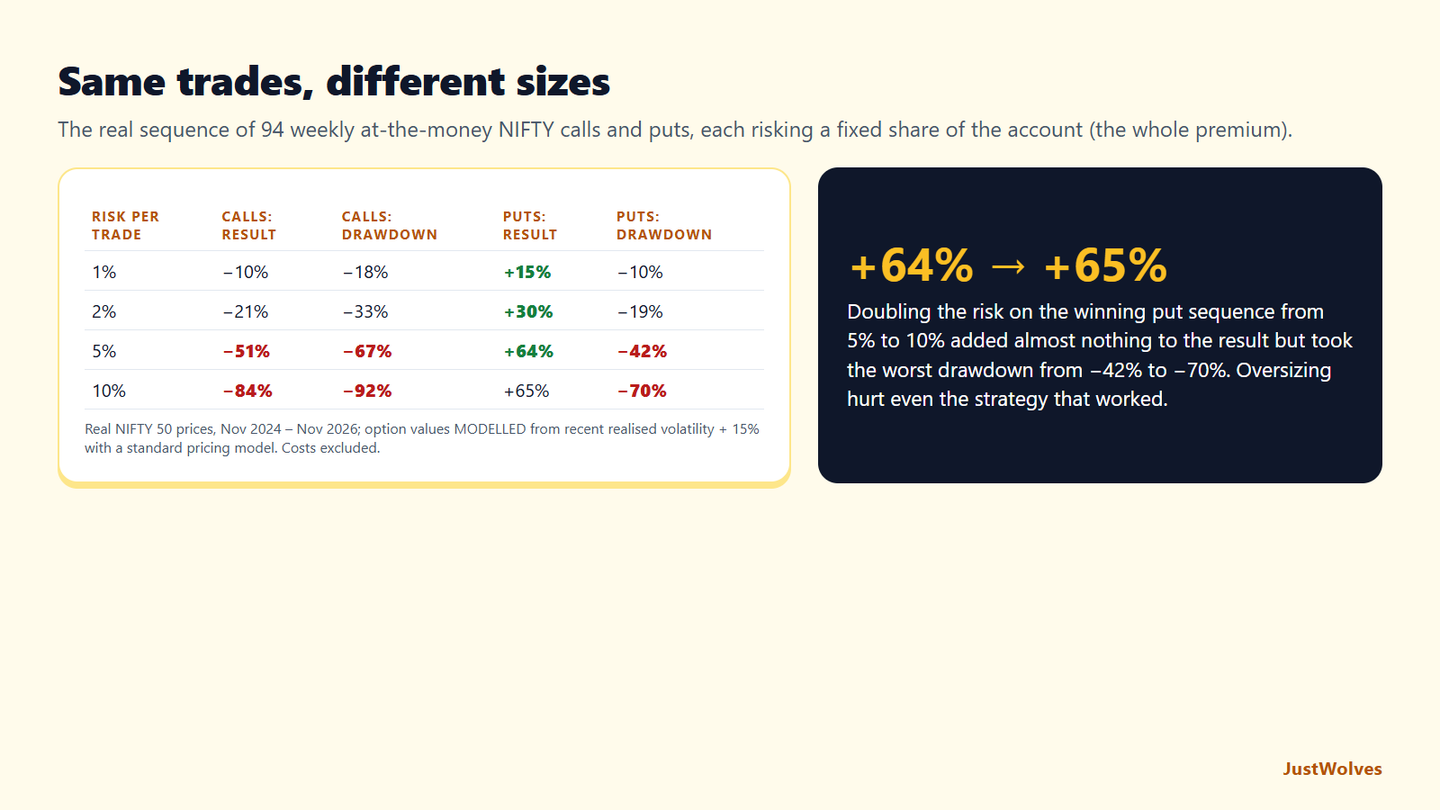
JustWolves tested three of this lesson's rules on about two years of real data (November 2024 to November 2026). Sizing: we took the real sequence of 94 weekly at-the-money NIFTY calls and puts, with modelled premiums, and ran them at 1%, 2%, 5% and 10% of the account risked per trade. Gaps: we counted how often NIFTY opened far from the previous close. Correlation: we checked how 20 large NSE stocks behaved on NIFTY's worst days.
| Risk per trade | Calls: result | Calls: worst drawdown | Puts: result | Puts: worst drawdown |
|---|---|---|---|---|
| 1% | −10% | −18% | +15% | −10% |
| 2% | −21% | −33% | +30% | −19% |
| 5% | −51% | −67% | +64% | −42% |
| 10% | −84% | −92% | +65% | −70% |
Size decided the damage. The weekly call sequence lost money at every size, but at 1% risk the worst drawdown was 18%, recoverable, and at 10% it was 92%, effectively the end of the account. Even the winning sequence was hurt by oversizing: the weekly puts made 64% at 5% risk and only 65% at 10%, while their worst drawdown went from 42% to 70%. Beyond a point, larger size adds risk faster than it adds return, because a run of losses at a large size leaves too little capital for the winners to rebuild.
| Measure | Result |
|---|---|
| Days NIFTY opened more than 100 points from the previous close | 25% |
| … more than 200 points | 8% |
| … more than 300 points | 4% (21 days) |
| Largest opening gap | +1,220 points (3 February 2026) |
| Share of the 20 stocks that fell on NIFTY's 10 worst days | 95% |
| Share that fell on an average day | 50% |
| Five bank stocks on NIFTY's 10 worst days | −2.49% on average, against −2.29% for NIFTY |
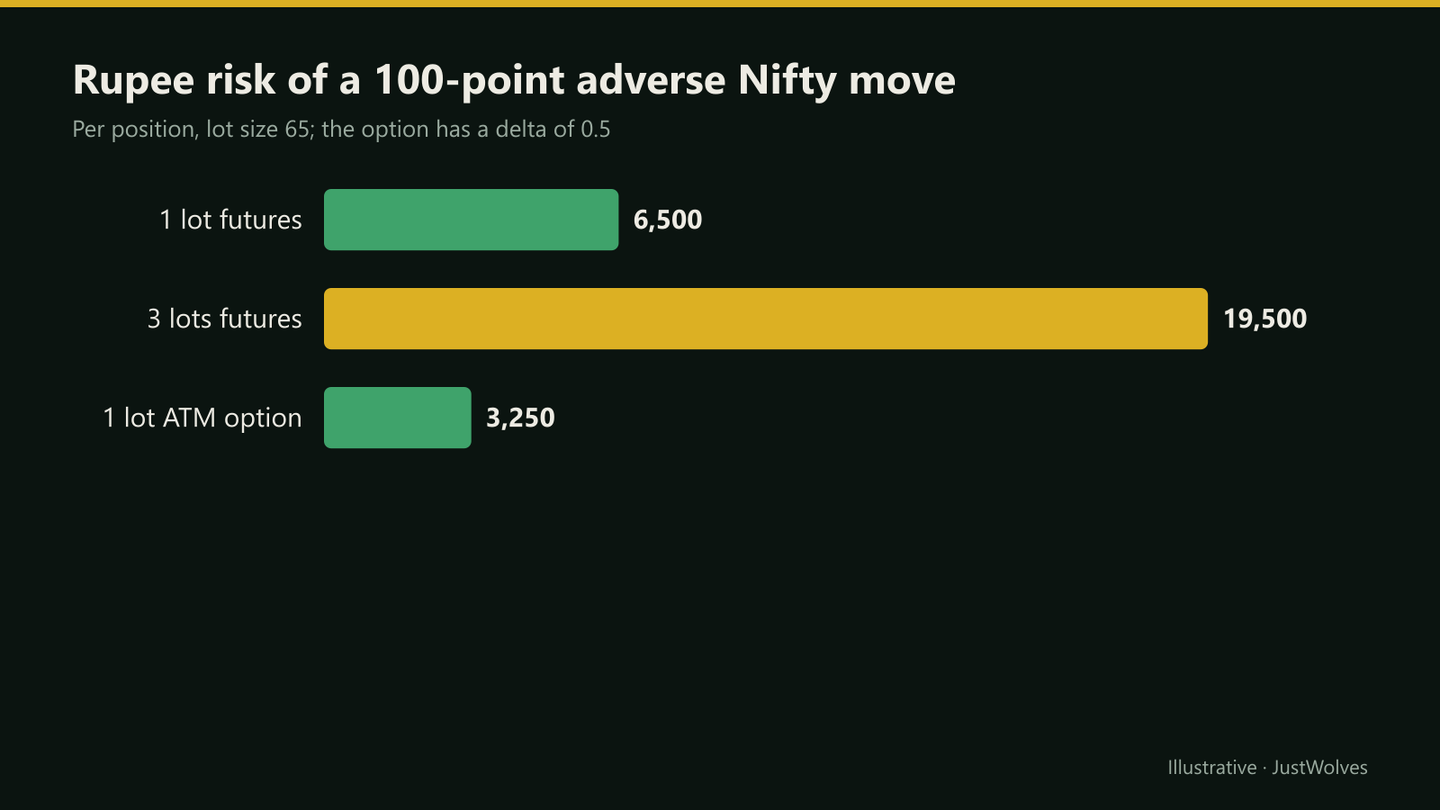
Gaps were common: one session in four opened more than 100 points away, and one in 25 more than 300 points, about ₹19,500 per lot before the stop could act. A futures stop of 100 or 120 points is therefore an estimate of risk, not a guarantee, which is why this lesson prefers defined-risk structures while learning.
On bad days, almost everything fell together. On NIFTY's ten worst days, 95% of the stock positions in our sample fell, against half on an average day, and bank stocks fell slightly more than the index. This is the scenario in this lesson's section on correlated positions: a long NIFTY future, a bank index call spread and some bank stock options are three positions on an ordinary day and one position on a bad one. Count them together against your maximum open risk.
Common Mistakes
- Sizing by available margin.
- Adding lots after losses to 'recover'.
- No daily loss limit.
- Selling naked options with a small account.
- Trading through events at full size.
Professional Insight
Professional derivatives desks are defined more by their limits than their strategies: limits on delta, gamma, vega, margin use and daily loss, enforced automatically. Applying even a simple version of that discipline puts a retail trader ahead of most participants.
Risk Considerations
- Leverage turns small errors into large losses.
- Gaps can bypass stops.
- Emotional decisions escalate quickly after losses.
Important Terminology
| Term | Meaning |
|---|---|
| Risk per lot | The rupee loss per lot if the stop is hit or the premium is lost. |
| Margin buffer | Spare funds beyond the required margin. |
| Defined risk | A maximum loss known at entry. |
| Daily loss limit | A loss after which you stop trading for the day. |
| Open risk | The combined potential loss of all open positions. |
How much should I risk per F&O trade?
Many traders risk 0.5–2% of their account per trade, sized from the stop or premium.
How many lots should I trade?
Divide your risk per trade by the risk per lot, and round down. If that's less than one, the trade is too large for the account.
Is option buying safer than futures?
Its maximum loss is defined, which helps risk control, but losing the whole premium is common.
What is a good margin buffer?
Many conservative traders keep margin used well below half their account value.
Should beginners sell options?
Naked option selling isn't recommended for beginners because of its rare but very large losses.
How often does NIFTY gap past a stop loss?
In our two years of real data, NIFTY opened more than 100 points from the previous close on about 25% of days and more than 300 points on about 4%. The largest gap was 1,220 points, in February 2026. Size futures trades so that a gap of that kind is survivable.
What happens if I risk too much per trade?
In our test of 94 real weekly NIFTY option trades with modelled premiums, risking 1% per trade gave a worst drawdown of 18% on the losing call sequence; risking 10% gave 92%. Even the profitable put sequence earned almost nothing extra at 10% compared with 5%, while its drawdown rose from 42% to 70%.
Practical Exercise
Write your F&O risk rules.
Your task
Step 1: Set limits
Risk per trade, daily and weekly loss limits, maximum margin use.
Step 2: Size three trades
A futures trade, a bought option and a spread, using your limits.
Step 3: Write event rules
What you do before results, policy days and expiry.
Step 4: Review weekly
Check every trade against your rules in your journal.
Check Your Understanding
F&O positions should be sized from:
Related Lessons
Previous: NSE Contract Rules and SEBI F&O Regulations. This completes the Futures & Options course. Continue with Option Selling Strategies, or see Position Sizing.