
Put-Call Ratio (PCR): What It Shows and Its Limits
JustWolves is an educational platform and is not a SEBI-registered investment advisor. Trading financial instruments involves significant risk of loss and may not be suitable for all investors. Past performance is not indicative of future results. Read our full disclaimer →
What you'll learn
- PCR = put open interest ÷ call open interest (or put volume ÷ call volume)
- A PCR above 1 means more puts than calls are open; below 1, more calls
- Interpretation depends on who's assumed to hold the positions, so PCR is read both as sentiment and as contrarian
- Extreme readings relative to the market's own history are more informative than any fixed threshold
- PCR is a context tool; it doesn't give timing or direction on its own
In this article · 16 sections
The put-call ratio is one of the most quoted numbers in Indian options commentary. It compresses the whole option chain into a single figure: how many puts are open relative to calls. That simplicity is both its appeal and its weakness. This lesson explains how PCR is calculated, the two opposite ways it's interpreted, and why it should be used as context rather than as a signal.
What You Will Learn
- How PCR is calculated
- OI-based versus volume-based PCR
- How traders interpret high and low readings
- The limits of PCR
Before You Start
Read Open Interest and Volume first.
Calculating PCR
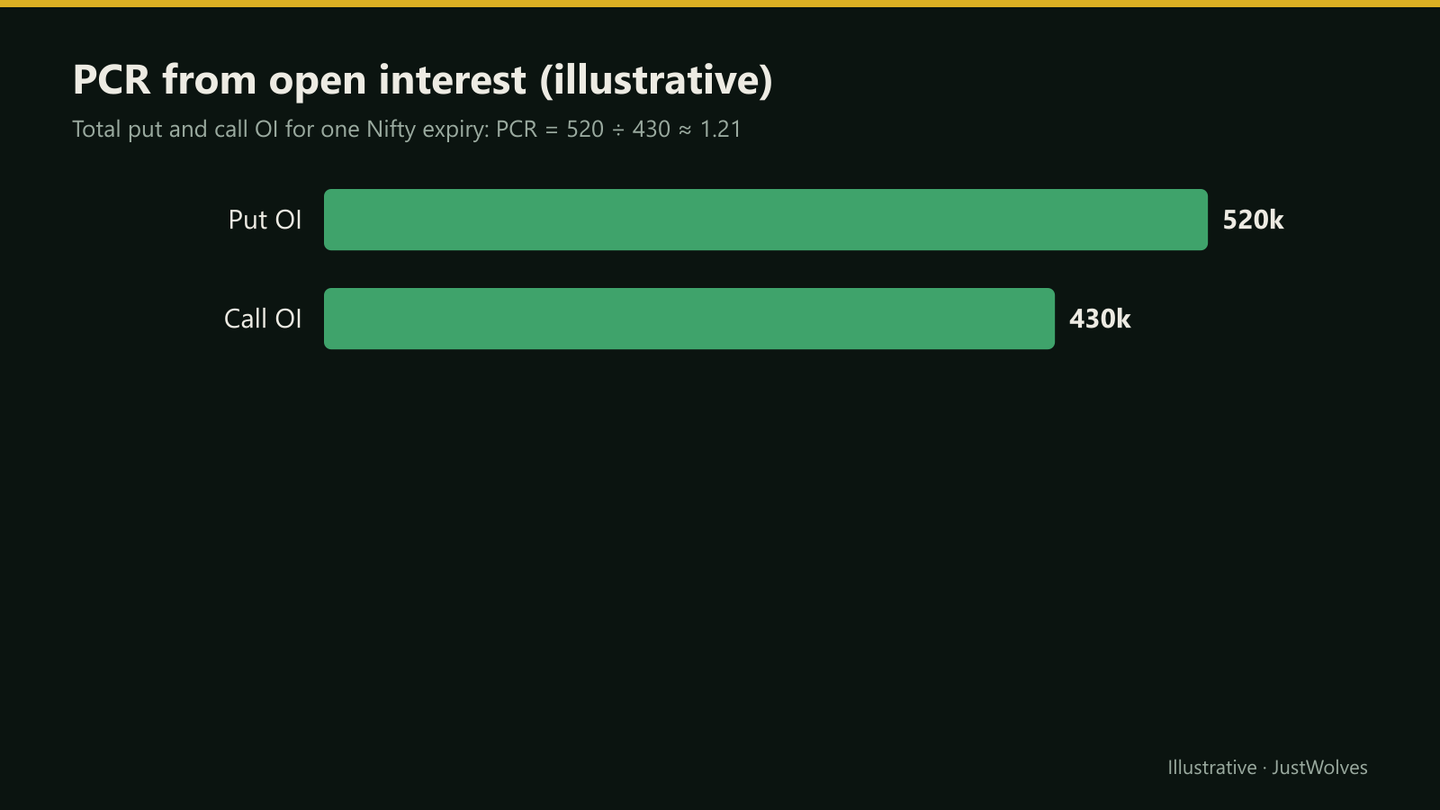
- OI PCR = total put open interest ÷ total call open interest, for one underlying and expiry (or all expiries).
- Volume PCR = total put volume ÷ total call volume for the session.
OI PCR reflects accumulated positioning; volume PCR reflects the day's activity and moves more. Most Indian market commentary quotes OI PCR for Nifty.
Two Opposite Readings
| Reading | Assumes | High PCR suggests | Low PCR suggests |
|---|---|---|---|
| Sentiment | Option buyers dominate | Bearish positioning (many puts bought) | Bullish positioning (many calls bought) |
| Seller-based / contrarian | Option writers dominate open positions | Put writers confident in support: bullish | Call writers confident in a ceiling: bearish |
In Indian index options, a large share of open interest is commonly attributed to option writers, which is why many local traders read a rising PCR as supportive rather than bearish. But OI data itself doesn't say who is long or short, so neither reading can be confirmed from PCR alone.
Where PCR Can Help
- Extremes: very high or very low PCR relative to recent history can flag crowded positioning.
- Divergence: price making new highs while PCR falls sharply may suggest weakening support from put writers.
- Context: combined with OI by strike and price structure, PCR helps describe the market's positioning.
Limits
- Hedging inflates put OI: institutions buy puts to protect portfolios, regardless of short-term views.
- Spreads and multi-leg strategies add OI on both sides without a directional view.
- Expiry-day and rollover effects distort readings.
- PCR has no timing component: an extreme can persist for days.
PCR by Strike and by Expiry
PCR can also be calculated for a single strike, dividing that strike's put OI by its call OI. A strike with a very high put-to-call ratio is one where put open interest heavily outweighs calls, which some traders watch as a possible support area. This is the same strike-level OI reading covered in the previous lesson, expressed as a ratio.
It also matters which expiries are included. A PCR for the nearest weekly expiry reflects short-term positioning and swings quickly. A PCR across all expiries is smoother and includes longer-dated hedges. Quoted PCR figures rarely say which they use, so check before comparing numbers from different sources.
Combining PCR with Price
PCR is most useful when it agrees or disagrees with what price is doing. A rising market with a steadily rising PCR suggests put writers are adding positions as the market climbs. A rising market with a falling PCR suggests that support is thinning. In both cases, the price chart remains the primary evidence; PCR adds a layer of context about positioning.
Real Prices: A Stretched Rally That Kept Going
The chart below uses real NIFTY 50 prices from April 2025, after a sharp sell-off and a fast rebound. We have no historical PCR values to show alongside it, so the chart shows the price behaviour that PCR extremes usually accompany, and what a contrarian reading of that crowding would have faced.
Real NIFTY prices: a stretched rally that kept going, April 2025
Step 1 of 4
A sharp fall
In early April 2025 NIFTY drops from 23,250 on 3 April to 22,162 on 7 April, opening on 7 April at 21,758, more than 1,100 points below the previous close.
- What to observe
- Fear peaks: the kind of session that fills the chain with put buying.
- Condition
- Positioning after a shock is rarely balanced.
Practical Example
Hypothetically, Nifty's OI PCR for the current expiry has ranged between 0.8 and 1.3 over the past month. After a three-day rally, it reaches 1.45, the highest in that period, with heavy put writing at 24,000.
Prakash reads this as a crowded, one-sided position. He doesn't short on PCR alone, but he tightens the stop on his existing long and waits for price confirmation before adding. Two sessions later, Nifty closes below 24,000 and PCR falls back to 1.1 as put positions are closed.
Do Sharp Moves Reverse? What We Could Test
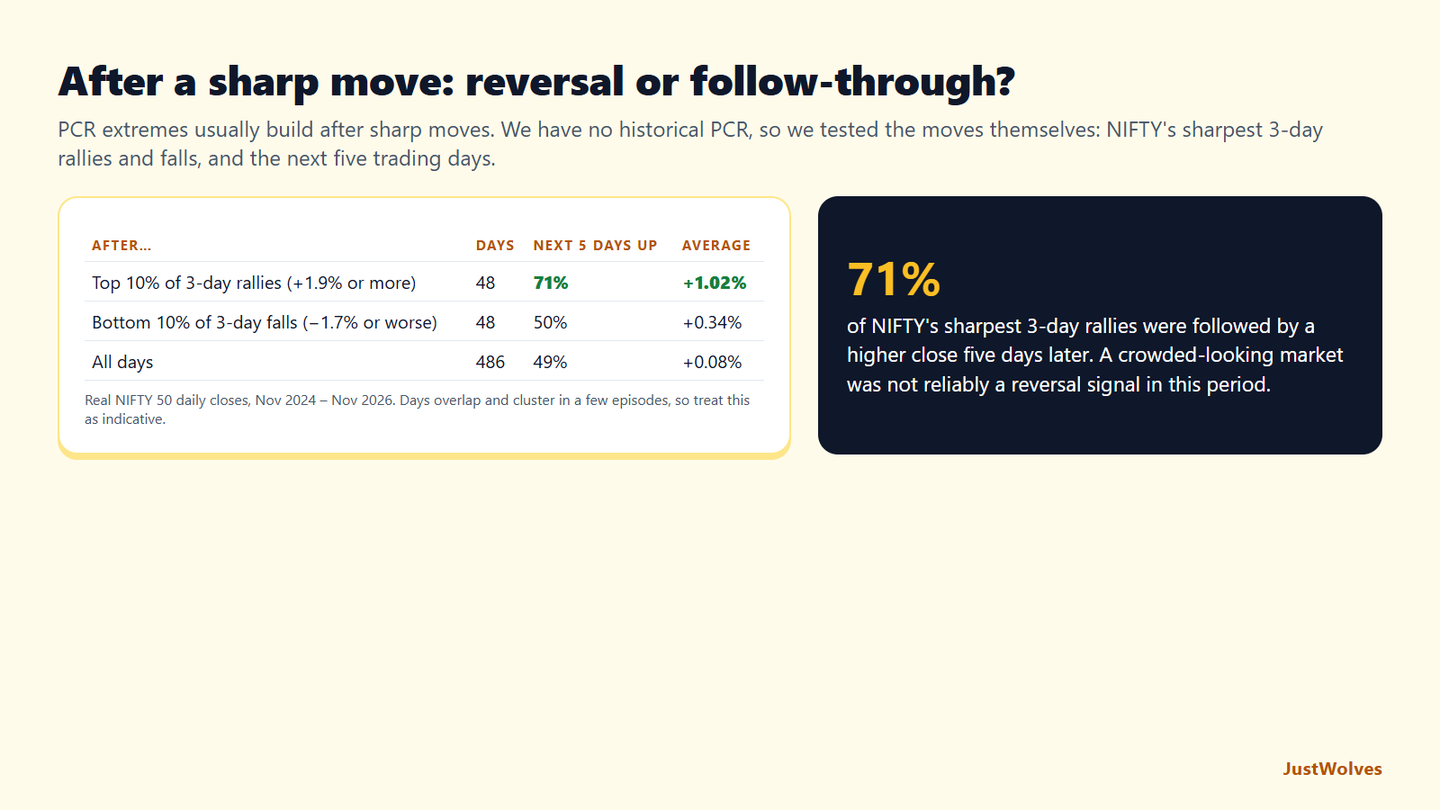
A contrarian reading of PCR is a bet that crowded positioning after a strong move will unwind. Our dataset does not include historical open interest, so JustWolves could not test PCR itself. We tested the next best thing: the moves that typically push PCR to extremes. Setup: NIFTY's sharpest three-day rallies and falls, the top and bottom 10% of all three-day moves over about two years of real data (November 2024 to November 2026). Outcome: whether NIFTY was higher five trading days later.
| After… | Days | Higher five days later | Average next-five-day move |
|---|---|---|---|
| Top 10% of three-day rallies (+1.9% or more) | 48 | 71% | +1.02% |
| Bottom 10% of three-day falls (−1.7% or worse) | 48 | 50% | +0.34% |
| All days | 486 | 49% | +0.08% |
Sharp rallies were more often followed by further gains than by reversals: 71% of the sharpest three-day rallies were higher again five days later. Sharp falls were a coin flip, with a slight average rebound. In this period, fading a stretched move, the logic behind reading a high PCR as "overbought", would have lost more often than it won.
Two cautions keep this in proportion. The 48 rally days are not independent: many come from the same few episodes, such as April 2025 in the chart above and early November 2026, so a different two years could look different. And this is a test of price, not of PCR. But it supports the warnings in this lesson: extremes can persist in strong trends, and PCR has no timing component. A stretched reading tells you positioning is one-sided; price still has to confirm that the move is ending.
This is also why the lesson's exercise matters. Recording PCR yourself each day, alongside price, is the only way to see how your own market's readings behave around turns. Most published PCR rules of thumb come with no record of how they performed.
Common Mistakes
- Using PCR as a buy or sell signal on its own.
- Applying fixed thresholds across different markets and periods.
- Mixing OI PCR and volume PCR.
- Ignoring hedging flows that inflate put OI.
- Forgetting which expiry the PCR covers.
Professional Insight
Professionals rarely trade PCR directly. They use it as one input in a picture of positioning, giving it weight mainly at extremes and when it diverges from price. The chart and risk plan still decide the trade.
Risk Considerations
- Extremes can persist in strong trends.
- Interpretations conflict, so confirmation bias is easy.
- Data snapshots can be delayed intraday.
Important Terminology
| Term | Meaning |
|---|---|
| PCR | Put-call ratio: puts relative to calls. |
| OI PCR | Put OI ÷ call OI. |
| Volume PCR | Put volume ÷ call volume. |
| Contrarian indicator | A measure read against the crowd's apparent view. |
| Divergence | Price and indicator moving in different directions. |
What is the put-call ratio?
The ratio of put open interest (or volume) to call open interest (or volume).
Is a high PCR bullish or bearish?
It depends on the assumed holders. Many Indian traders read high Nifty PCR as supportive because they assume put writers dominate, but the data can't confirm that.
What is a good PCR level?
There's no universally correct level. Compare readings with the same market's recent range.
Where can I find Nifty PCR?
Calculate it from NSE's option chain totals, or check your broker's analytics tools.
Should I trade based on PCR?
Not on its own. Use it as context alongside price action and risk management.
Does a high PCR mean the market will fall?
Not reliably. A high PCR often builds during strong rallies as put writers add positions. In our test of real NIFTY data, the sharpest three-day rallies were followed by further gains five days later 71% of the time, so fading crowded moves without price confirmation would often have been early.
Can I backtest the put-call ratio?
Only with a history of daily open interest for calls and puts, which most free sources do not keep. The practical alternative is to record PCR yourself each day, together with the index close, and review how readings behaved around turning points after a few months.
Practical Exercise
Build a PCR history.
Your task
Step 1: Record daily
Nifty OI PCR for the current expiry for one month.
Step 2: Note the range
Highest and lowest readings.
Step 3: Mark extremes
Days in the top and bottom 10% of the range.
Step 4: Check price
What did Nifty do over the following three sessions?
Check Your Understanding
OI PCR is:
Related Lessons
Previous: Open Interest and Volume. Next module: Option Buying: Strategies and Risks.