
Execution Speed and Transaction Costs
JustWolves is an educational platform and is not a SEBI-registered investment advisor. Trading financial instruments involves significant risk of loss and may not be suitable for all investors. Past performance is not indicative of future results. Read our full disclaimer →
What you'll learn
- An intraday round trip pays brokerage, STT, exchange charges, SEBI fees, GST and stamp duty
- From 1 April 2026, STT is 0.05% on futures sales and 0.15% on the option premium sold
- One-lot Nifty futures round trips cost about 14 points; one-lot Nifty option round trips about 1 premium point
- Flat brokerage means cost per unit falls as size rises, but risk rises with it
- Execution speed matters most when targets are small; a stable setup and practised order entry reduce errors
In this article · 13 sections
Every intraday trade starts in a hole: before price moves, you've already committed to paying a set of charges that the trade has to earn back. For a scalper, that hole can be most of the target. This lesson lists every charge on an Indian intraday trade, works through real examples using the site's brokerage calculator, and covers the execution habits that keep hidden costs down.
What You Will Learn
- Every charge on an intraday trade
- Worked costs for options, futures and stocks
- Break-even points per trade
- Execution practices that reduce costs and errors
Before You Start
Read Liquidity, Bid-Ask Spreads and Slippage. You can reproduce every number in this lesson with the Brokerage Calculator.
The Charges
| Charge | Options | Futures | Equity intraday |
|---|---|---|---|
| Brokerage (discount broker) | ₹20 per order | ₹20 or 0.03% per order, whichever is lower | ₹20 or 0.03% per order, whichever is lower |
| STT | 0.15% of premium, sell side | 0.05%, sell side | 0.025%, sell side |
| Exchange transaction charge | 0.03553% of premium turnover | 0.00183% of turnover | 0.00307% of turnover |
| SEBI fee | ₹10 per crore | ₹10 per crore | ₹10 per crore |
| GST | 18% on brokerage, exchange and SEBI charges | Same | Same |
| Stamp duty | 0.003%, buy side | 0.002%, buy side | 0.003%, buy side |
The STT rates for futures and options were raised from 1 April 2026. Rates change from time to time, and brokers differ; check your broker's charge sheet before relying on any figure.
Worked Examples
| Trade | Gross | Charges | Net | Break-even move |
|---|---|---|---|---|
| Nifty option, 1 lot (65), buy 120 sell 126 | ₹390 | ₹66 | ₹324 | 1.0 point |
| Nifty option, 5 lots (325), buy 120 sell 126 | ₹1,950 | ₹143 | ₹1,807 | 0.44 point |
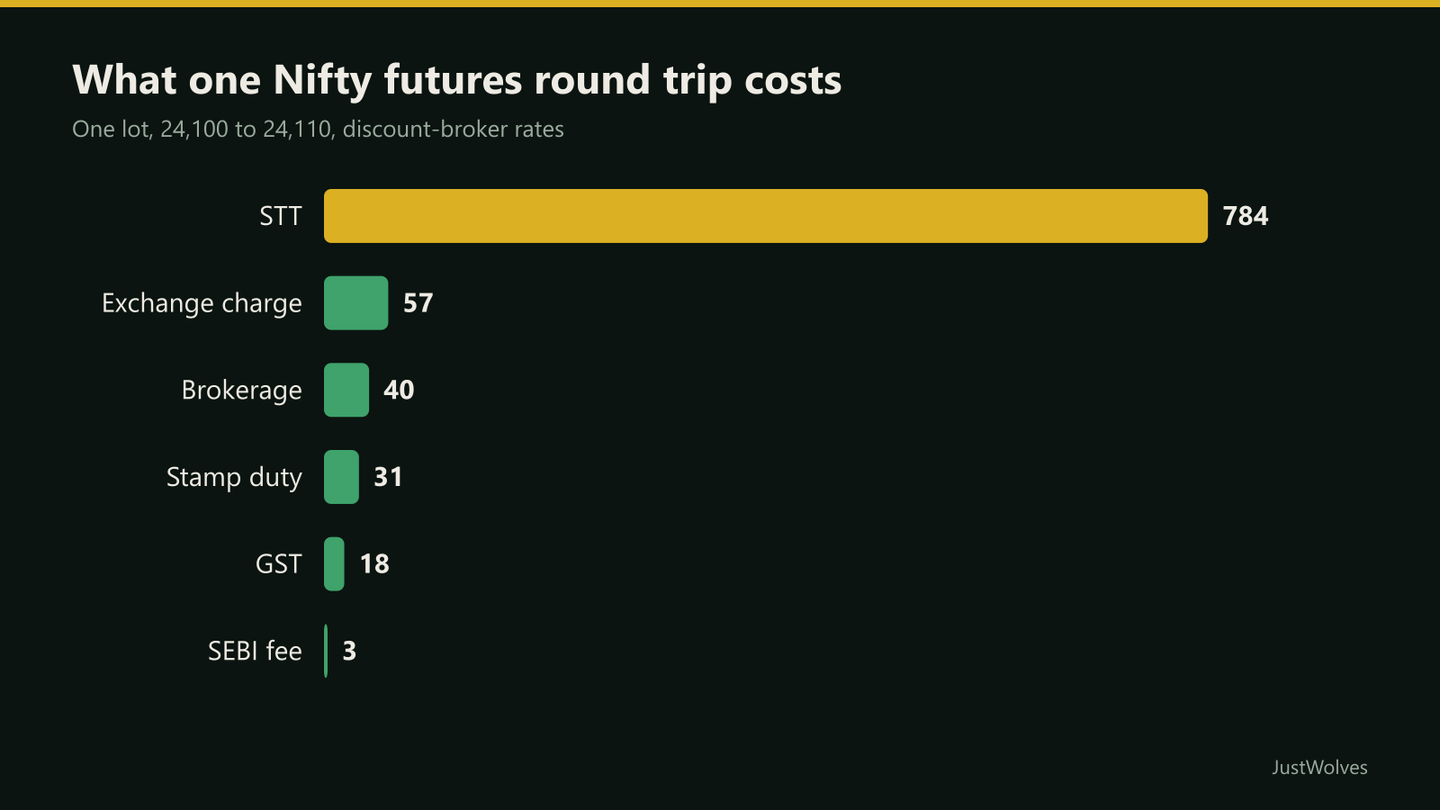
| Nifty futures, 1 lot, 24,100 to 24,110 | ₹650 | ₹933 | −₹283 | 14.4 points |
| Nifty futures, 1 lot, 24,100 to 24,160 | ₹3,900 | ₹935 | ₹2,965 | 14.4 points |
| Stock intraday, 300 shares, ₹820 to ₹823 | ₹900 | ₹135 | ₹765 | ₹0.45 |
Two patterns stand out. First, Nifty futures charges are dominated by STT: about ₹784 of the ₹933 on the first futures trade. A futures scalp needs to move well over 14 points just to break even. Second, option charges are dominated by the flat brokerage, so they fall per unit as size rises, from about 1 point on one lot to under half a point on five.
Larger size lowers the cost per unit but raises the rupee risk. Size should come from your risk rules, not from the wish to dilute charges.
Execution Speed
For a swing trader, a few seconds' delay rarely matters. For a scalper targeting a few points, a delay in reading the chart, choosing a strike and entering the order can cost a meaningful part of the move.
Most retail execution delay is human, not technical: hesitation, fumbling between windows, or entering the wrong quantity. A stable internet connection and a responsive platform help, but the larger gains come from practice and preparation.
- Prepare the order screen before the setup triggers: instrument, quantity and order type ready.
- Use hotkeys or saved order templates if your platform supports them.
- Set the stop immediately after entry, as an order rather than a mental note.
- Check quantity in lots and units; errors here are expensive.
- Avoid trading during platform or connection problems. Know your broker's emergency exit process.
Real Prices: What a Minute of Delay Does
How much does a slow entry cost? The chart below shows a real NIFTY 50 scalp signal on 23 October 2026, entered on time and one, two and three minutes late. The delay moved the entry price by up to 26 points, in both directions.
Real prices: a scalp signal entered on time and one, two or three minutes late, NIFTY 50, 23 October 2026
Step 1 of 4
The setup
On 23 October 2026, NIFTY 50 rallies to 22,730.9 at 9:43, then falls back quickly over the next five minutes.
- What to observe
- A scalper is watching for a break of the morning's 30-minute low.
- Condition
- Rule: sell a 5-minute close below the previous 30 minutes' low; 20-point target and stop.
Practical Example
Hypothetically, Rohan scalps Nifty futures, aiming for 20 points with a 15-point stop on one lot. Before costs, that looks like 1.33R. After about 14.4 points of charges, a win nets about 5.6 points and a loss costs about 29.4 points. His real reward-to-risk is about 0.2, and he would need to win about 84% of trades to break even.
He switches to targeting larger intraday moves of 60 points with a 25-point stop. After charges, a win nets about 45.6 points and a loss costs about 39.4, so the break-even win rate falls to about 46%.
Does Entering Late Cost Money? Our Test
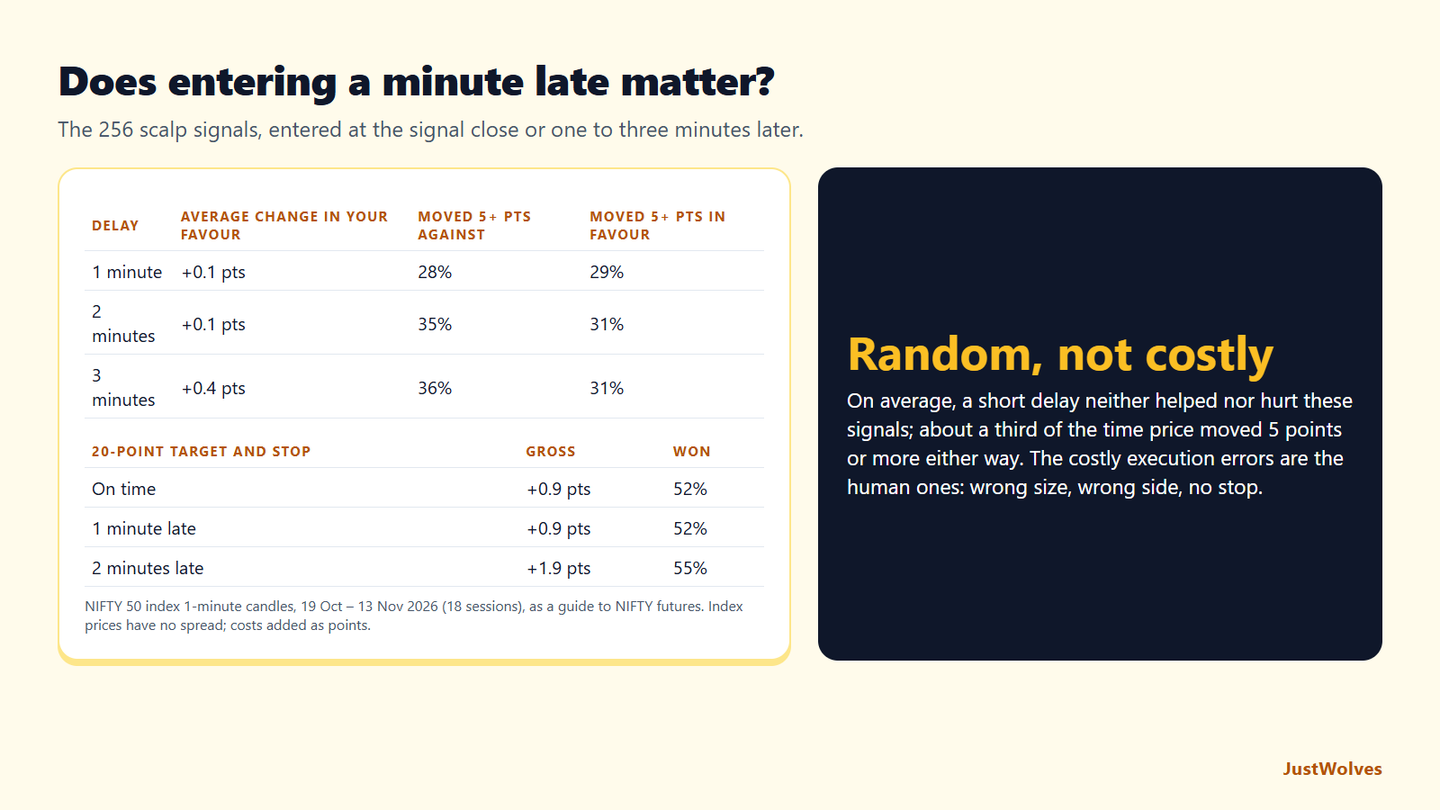
JustWolves measured the effect of delay on 256 scalp signals on NIFTY 50 1-minute prices over 18 sessions (19 October to 13 November 2026). The signal was a 5-minute close beyond the previous 30 minutes' high or low, between 9:30 am and 2:45 pm. For each, we measured how far price moved in the trade's direction one, two and three minutes after the signal, and ran the same 20-point target-and-stop trade entered on time and late.
| Delay after the signal | Average change in the trade's favour | Moved 5+ points against | Moved 5+ points in favour |
|---|---|---|---|
| 1 minute | +0.1 pts | 28% | 29% |
| 2 minutes | +0.1 pts | 35% | 31% |
| 3 minutes | +0.4 pts | 36% | 31% |
On average, a short delay did not cost anything. Over 256 signals, price was as likely to move a few points in the trader's favour as against them in the minutes after a signal, and the 20-point trade did no worse when entered one or two minutes late. For simple rules like this one, entry timing at the scale of a minute was close to random.
Each individual delay was still a gamble. About three times in ten, a one-minute delay moved the entry by 5 points or more in either direction. On a 20-point scalp that is a quarter of the target, so delay adds variability to results even when it does not change the average.
The costs that did not vary were larger. A 14.5-point futures round trip is charged on every trade, delayed or not. Compared with that certain cost, a random entry difference that averages zero is a minor issue. This supports the lesson's view that the important execution errors are human ones, such as the wrong quantity, the wrong instrument or no stop order, rather than seconds of latency for a retail trader.
The professional insight in this lesson still applies: know your all-in cost per trade, and take only setups whose expected move is several times that cost.
Common Mistakes
- Judging futures scalps on gross points.
- Sizing up to dilute brokerage without adjusting risk.
- Ignoring STT changes when comparing old backtests.
- Mental stops instead of orders.
- Unpractised order entry under time pressure.
Professional Insight
Experienced day traders usually know their all-in cost per trade, charges plus typical slippage, without looking it up. They use it to filter setups: if the expected move isn't several times that cost, they don't trade. Many say this single habit removed more losing trades than any indicator.
Risk Considerations
- Charges change with budgets and exchange circulars.
- Order errors can be costly in seconds.
- Platform outages can prevent exits.
Important Terminology
| Term | Meaning |
|---|---|
| STT | Securities transaction tax, charged on the sell side for intraday and F&O. |
| Exchange transaction charge | A fee charged by the exchange on turnover. |
| Stamp duty | A state levy on the buy side. |
| Break-even move | The price move needed to cover all charges. |
| Turnover | The total value bought and sold. |
What charges apply to intraday trades in India?
Brokerage, STT, exchange transaction charges, SEBI fees, GST and stamp duty.
What is the STT on futures and options?
From 1 April 2026, 0.05% on futures sales and 0.15% on the option premium sold.
How many points does a Nifty futures trade need to break even?
About 14 points per lot at discount-broker rates, before slippage.
Why are option charges lower than futures charges?
STT and exchange charges on options are levied on the premium, which is much smaller than a futures contract's value.
Does trading more lots reduce costs?
Flat brokerage is spread over more units, but percentage charges scale with size, and risk rises too.
How much does a one-minute delay cost a NIFTY scalper?
On average, almost nothing in our test: across 256 NIFTY 50 scalp signals, price moved about 0.1 points in the trader's favour one minute after the signal. But in about 28% of cases it moved 5 points or more against them, and in 29% by as much in their favour.
What is the break-even move for a NIFTY futures scalp?
About 14 to 15 index points per one-lot round trip at discount-broker rates, mostly STT on the sell side. With equal target and stop, a 20-point futures scalp needs to win about 86% of trades just to break even.
Practical Exercise
Know your numbers.
Your task
Step 1: Enter your typical trade
In the brokerage calculator, with your broker's rates if different.
Step 2: Record the break-even move
In points or rupees per unit.
Step 3: Recalculate your reward-to-risk
Using net, not gross, figures.
Step 4: Set a minimum target
At least several times your all-in cost.
Check Your Understanding
STT on futures from 1 April 2026 is:
Related Lessons
Previous: Liquidity, Bid-Ask Spreads and Slippage. Next: Sessions and Timeframes: 1-, 3- and 5-Minute Charts. See also the Brokerage Calculator.