
EMA Scalping with Supply, Demand and Momentum Candles
JustWolves is an educational platform and is not a SEBI-registered investment advisor. Trading financial instruments involves significant risk of loss and may not be suitable for all investors. Past performance is not indicative of future results. Read our full disclaimer →
What you'll learn
- Supply and demand zones are named by the move into and out of a base: RBD, DBD, DBR and RBR
- Valid zones have a compact base (one to five candles), a strong departure and no retests since forming
- The momentum candle signal is a long wick into the zone, at least twice the body, closing back outside it
- The 8 EMA crossover at the zone confirms short-term momentum has turned
- Enter only when zone, candle and EMA agree, and only if the next opposite zone offers enough reward after costs
In this article · 16 sections
This method combines three separate pieces of evidence before a scalp: a fresh supply or demand zone, a candle showing the zone being defended, and a fast moving average confirming that short-term momentum has turned. Each piece on its own produces many false signals; together they filter most of them out. This lesson covers how to identify valid zones, read the momentum candle, use the 8 EMA crossover, and combine them into a complete trade with costs included.
What You Will Learn
- The four supply and demand zone types
- How to judge whether a zone is valid
- The momentum candle and 8 EMA signals
- The three-confluence entry, targets and scaling in
Before You Start
Four Zone Types
| Pattern | Type | Meaning |
|---|---|---|
| Rally-Base-Drop (RBD) | Supply, reversal | Sellers turned an advance into a decline |
| Drop-Base-Drop (DBD) | Supply, continuation | A pause in a decline, where sellers added |
| Drop-Base-Rally (DBR) | Demand, reversal | Buyers turned a decline into an advance |
| Rally-Base-Rally (RBR) | Demand, continuation | A pause in an advance, where buyers added |
The base is the short consolidation before the strong move away; it's the zone itself. Reversal zones (RBD, DBR) mark a change of direction and are often treated as stronger; continuation zones (DBD, RBR) suit trading with an existing trend.
Is the Zone Valid?
- Strong departure: price left the base with a large candle, roughly twice the size of the base candles or more.
- Compact base: one to five candles. Longer bases have usually absorbed more of the interest.
- Fresh: price hasn't returned to the zone since it formed.
- Clear boundaries: the top and bottom of the base are easy to see.
Avoid zones with long, messy bases, zones already tested twice or more, and zones sitting inside a larger opposing zone on the higher timeframe.
Signal 1: The Momentum Candle
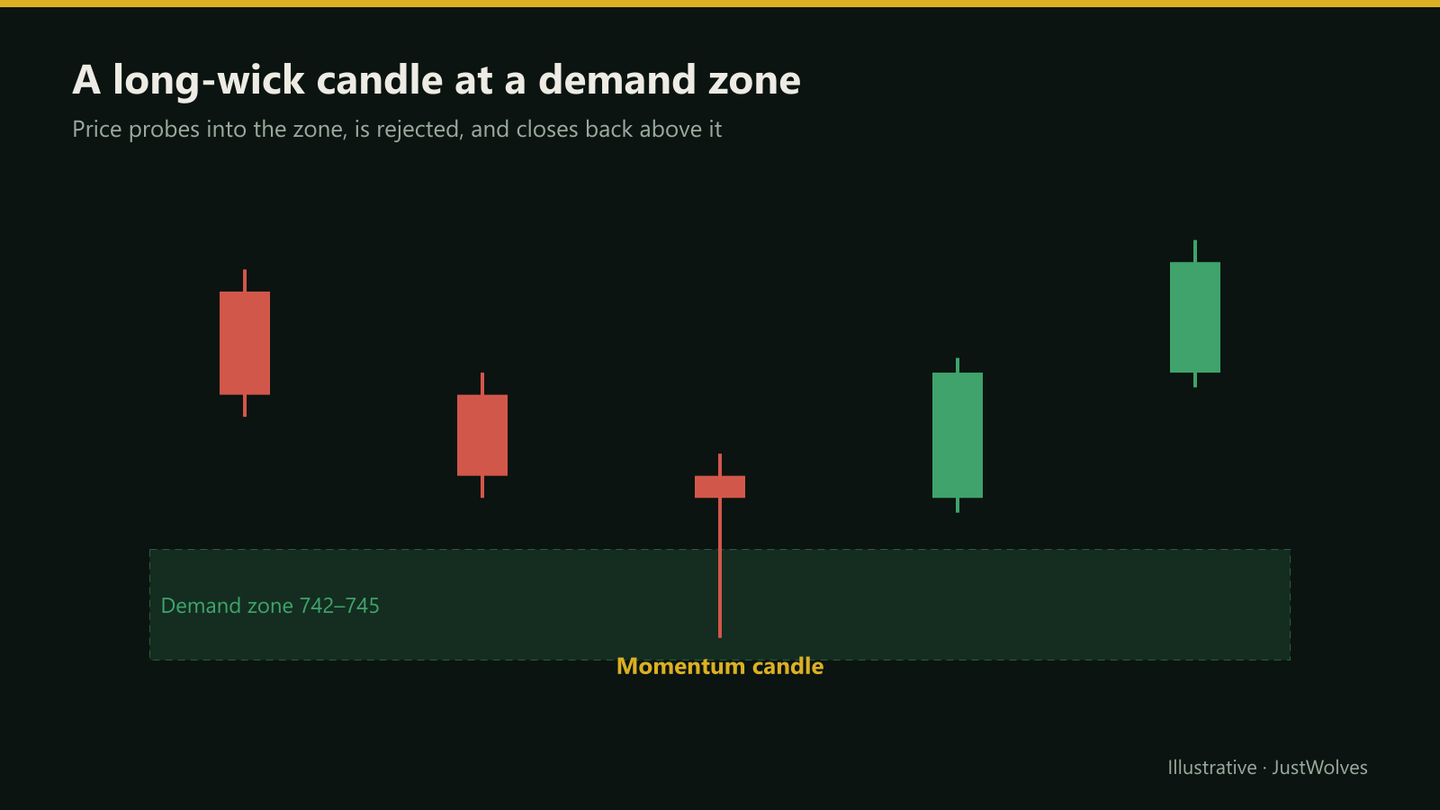
When price reaches a demand zone and a candle forms with a long lower wick, buyers have absorbed the selling and pushed price back up before the close. The mirror image, a long upper wick at a supply zone, shows sellers defending it.
The stronger versions have a wick at least twice the body, a wick reaching at least the middle of the zone, and a close back at or beyond the zone's edge. Several wicks at the same level over consecutive candles show the zone being defended repeatedly.
Signal 2: The 8 EMA Crossover
The 8-period exponential moving average follows price closely on 3 and 5-minute charts. At a demand zone, a candle closing above the 8 EMA after trading below it shows short-term momentum turning up; at a supply zone, a close below it shows momentum turning down.
On its own, the 8 EMA crosses back and forth constantly. Its value here is as confirmation at a zone that's already been identified, not as a signal anywhere on the chart.
The Three-Confluence Entry
Long checklist
Step 1: Zone
Price is at a fresh, valid demand zone (DBR or RBR).
Step 2: Candle
A long lower wick, or repeated wicks, at the zone.
Step 3: EMA
A close above the 8 EMA at or just after the zone.
Step 4: Higher timeframe
The 15-minute trend isn't strongly against the trade.
Step 5: Reward check
The next supply zone above is far enough away to justify the trade after costs.
The original version of this method requires at least 1:3 reward-to-risk to the next opposite zone. That's demanding, but it keeps targets well clear of costs. Entries can be aggressive (at the close of the wick candle) or conservative (after one or two confirming candles in the trade's direction), at the cost of a worse price.
Stops, Targets and Scaling In
The stop goes beyond the zone: below the base's low for longs, above the base's high for shorts. The target is the nearest opposite zone.
If price forms a new small base in the trade's direction (an RBR inside a long), some traders add a second position there. The rule is to move the first position's stop to breakeven before adding, so the combined trade never risks more than the original plan.
Real Prices: All Three Pieces Together
The example in this lesson is hypothetical. The chart below shows the method on real Infosys prices from 16 October 2026: a fresh demand zone with a strong departure, a first return with a long lower wick, and a close back above the 8 EMA.
Real prices: a demand zone, a wick and an 8 EMA cross, Infosys, 16 October 2026
Step 1 of 4
A fresh demand zone
After drifting down to ₹1,148.3 at 11:50 on 16 October 2026, Infosys pauses in one small candle at 12:00 (₹1,148.5–1,150.0), then leaves it with a 12:05 candle more than twice its size, closing at ₹1,152.2: a drop-base-rally demand zone.
- What to observe
- A short base and a strong departure: this lesson's validity checks.
- Condition
- The zone is fresh: price has not returned yet.
Practical Example
Hypothetically, a liquid stock's 3-minute chart shows a fresh DBR demand zone at ₹742–745 and the next supply zone at ₹762. At 10:30, price drops into the zone; a candle wicks to ₹742.60 and closes at ₹746.40, crossing back above the 8 EMA. The 15-minute trend is up.
Rahul buys 400 shares at ₹746.50 with a stop at ₹741.50, below the zone, risking ₹5 a share (₹2,000). His target is ₹762, ₹15.50 away (₹6,200), about 3.1R gross. Charges from the brokerage calculator are about ₹155 on a win and ₹153 on a loss: net, about +₹6,045 or −₹2,153, roughly 2.8R.
Does the Confluence Help? Our Test
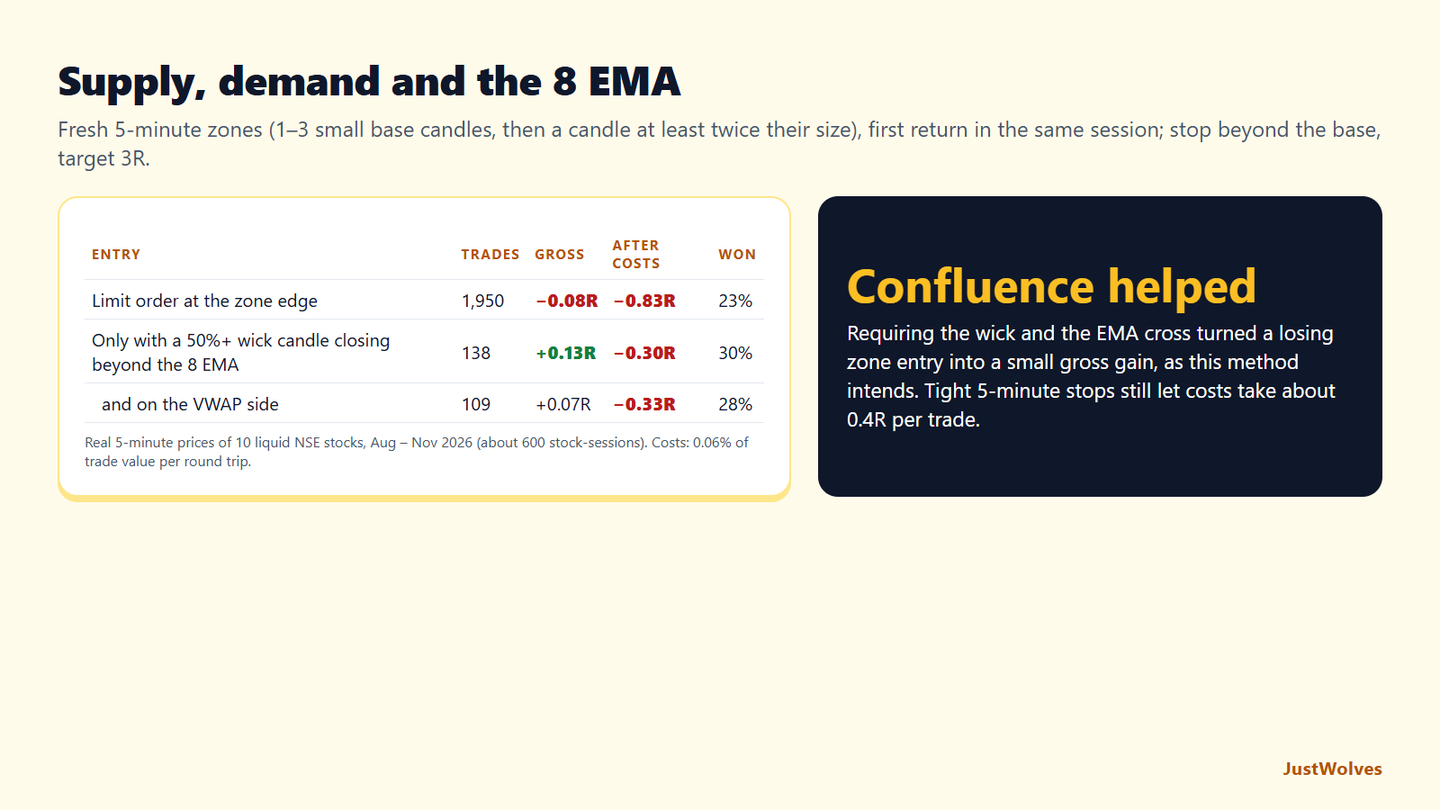
JustWolves tested this method on 5-minute prices for 10 liquid NSE stocks, about 58 sessions each from August to November 2026. Zones: one to three small base candles (each under 0.7 ATR) followed by a departure candle at least twice their average size, closing beyond the base. Entries on the first return in the same session: either a limit order at the zone edge, or only when the return candle had a wick of at least half its range and closed beyond the 8 EMA, entering at that close. Stops sat just beyond the base; targets were 3R, as this lesson's original version requires. Costs: 0.06% of trade value per round trip.
| Entry | Trades | Gross | After costs | Won |
|---|---|---|---|---|
| Limit order at the zone edge on the first return | 1,950 | −0.08R | −0.83R | 23% |
| Only with a 50%+ wick candle closing beyond the 8 EMA | 138 | +0.13R | −0.30R | 30% |
| and on the VWAP side of the trade | 109 | +0.07R | −0.33R | 28% |
The confluence did what this lesson says. Buying or selling a zone on the first touch, with no confirmation, lost money even before costs. Requiring the defending wick and the 8 EMA cross filtered out more than nine in ten touches and turned the remaining trades into a small gain before costs, +0.13R per trade with a 30% win rate at 3R. Each piece on its own produces many false signals; together they removed most of the worst ones.
Costs still decided the result. Zones on 5-minute charts are small, so the stop beyond the base was often only a few rupees, and 0.06% of costs took about 0.4R per trade. The 3R target, which this lesson calls demanding, is the method's defence against that: with smaller targets, the gross edge would have disappeared entirely.
The sample is small. Only 138 trades met all the conditions across 10 stocks and about 58 sessions, which echoes the professional insight in this lesson: strict about the zone, and patient for the signal. Adding a VWAP filter did not improve it. Treat the result as support for using the full confluence, not as proof of profitability.
Common Mistakes
- Trading old or repeatedly tested zones.
- Using the 8 EMA cross away from any zone.
- Entering on one confluence instead of three.
- Scaling in without moving the first stop to breakeven.
- Targets with too little room to the next zone.
Professional Insight
Traders who use confluence methods well tend to be strict about the zone and relaxed about the signal. A perfect wick at a weak, tested zone is skipped; a modest wick at a fresh, clean zone with a strong departure is taken. The location does most of the work.
Risk Considerations
- Zone identification is subjective.
- EMA crossovers whipsaw in ranges.
- Costs reduce small-target trades sharply.
Important Terminology
| Term | Meaning |
|---|---|
| Base | The short consolidation before a strong move; the zone itself. |
| DBR / RBD | Reversal demand and supply zones. |
| RBR / DBD | Continuation demand and supply zones. |
| Momentum candle | A long-wick rejection candle at a zone. |
| 8 EMA | An 8-period exponential moving average. |
What is supply and demand scalping?
Taking short-term trades from fresh supply and demand zones, usually with a confirming candle or indicator signal.
What does DBR mean?
Drop-Base-Rally: a demand zone where buyers reversed a decline.
Why the 8 EMA?
It reacts quickly on 3 and 5-minute charts, so a cross at a zone shows short-term momentum turning.
What is a momentum candle in this method?
A candle with a long wick into the zone, at least twice its body, closing back outside the zone.
Where do I put the stop?
Beyond the zone: below the base low for longs, above the base high for shorts.
Do supply and demand zones work for scalping?
Not on their own in our test. On 10 NSE stocks, limit entries at the first return to a fresh 5-minute zone averaged −0.08R per trade before costs with a 3R target. Adding a wick candle and an 8 EMA cross improved this to +0.13R before costs.
Why does this method require 1:3 reward-to-risk?
Because costs are large relative to small intraday stops. In our NSE test, costs of 0.06% of trade value took about 0.4R per 5-minute trade, so only large targets leave room for a gross edge to survive.
Practical Exercise
Score zones and signals.
Your task
Step 1: Mark ten fresh zones
On 3 or 5-minute charts of liquid stocks.
Step 2: Check validity
Departure, base size, freshness, boundaries.
Step 3: Record signals at each
Wick candle and 8 EMA cross.
Step 4: Compare outcomes
Trades with three confluences vs one or two, after costs.
Check Your Understanding
A Drop-Base-Rally zone is:
Related Lessons
Previous: Range, Breakout and Pullback Scalping. Next: Price Action Scalping. See also Supply and Demand Zones.