
Backtesting a Scalping Strategy with Real Costs
JustWolves is an educational platform and is not a SEBI-registered investment advisor. Trading financial instruments involves significant risk of loss and may not be suitable for all investors. Past performance is not indicative of future results. Read our full disclaimer →
What you'll learn
- A scalping backtest must deduct charges and slippage from every trade; small gross edges often disappear
- Model costs per trade from the brokerage calculator, and add a conservative slippage estimate
- 1-minute candles hide what happened inside each candle; assume the worse outcome when a stop and target fall in the same candle
- Fix the rules before testing, include every signal, and test across different market conditions
- Forward-test on paper with live costs before trading real money
In this article · 14 sections
Scalping backtests are especially easy to get wrong. The edges are small, the costs per trade are large relative to them, and short-timeframe data hides important details. A method that looks profitable on a chart review can lose money once charges and slippage are deducted. This lesson shows how to backtest a scalping method honestly, with a worked example of a gross edge that turns negative after costs.
What You Will Learn
- How to model costs and slippage per trade
- The data problems specific to short timeframes
- A step-by-step backtest process
- How to read the results
Before You Start
Read Stop-Loss Discipline and Scalping Risk Management, Execution Speed and Transaction Costs and How to Backtest a Trading Strategy.
Model Costs and Slippage
Every simulated trade needs its full round-trip cost deducted. Use the Brokerage Calculator for your typical trade: about 1 premium point per lot on Nifty options, about 2.3 points per lot on Bank Nifty options, and about 14 points per lot on Nifty futures, at discount-broker rates.
Then add slippage. Without real fill data, a conservative assumption is better than none: for example, half a premium point per round trip on liquid near-the-money options, more on stop exits and around the open. Once you start trading, replace the assumption with your measured average.
Short-Timeframe Data Problems
- Inside-candle ambiguity: a 1-minute candle shows the high and low, not which came first. If both your stop and target fall within one candle, assume the stop was hit.
- Option data quality: historical option candles can have gaps, stale prices or wide spreads not visible in the chart.
- Hindsight: levels and zones drawn after the fact are cleaner than those you'd have drawn live. Mark them using only data available at the time.
- Small samples: scalping methods produce many trades, but they're often clustered in similar conditions. Test across trending, sideways and event days.
A Step-by-Step Process
Backtesting a scalp honestly
Step 1: Write the rules
Setup, trigger, stop, target, time filters and daily limits, specific enough for someone else to apply.
Step 2: Pick the sample in advance
A date range covering different conditions, decided before you look.
Step 3: Record every signal
Including ones that look bad in hindsight and days with no signal.
Step 4: Deduct costs and slippage
From every trade, in points or rupees.
Step 5: Apply daily rules
Stop after the daily loss limit, as you would live.
Step 6: Calculate net expectancy
Average net result per trade, and per day.
Step 7: Forward-test
Paper-trade the same rules with live prices and costs for several weeks.
Real Prices: An Ambiguous Candle
This lesson's process says to assume the stop when a candle contains both the stop and the target. The chart below shows why, and what it costs, on a real NIFTY 50 trade from 2 November 2026: a 5-minute candle that hit both levels, resolved on the 1-minute chart.
Real prices: one ambiguous 5-minute candle, resolved on the 1-minute chart, NIFTY 50, 2 November 2026
Step 1 of 4
The trade
On 2 November 2026 a 5-minute NIFTY 50 candle closes at 23,231.8 at 1:10 pm, below the previous 30 minutes' low: a short signal in our scalp test, with a 20-point target (23,211.8) and stop (23,251.8).
- What to observe
- A rule-based trade, ready to be backtested.
- Condition
- Now look at it the way a 5-minute backtest would.
Reading the Results
The key number is net expectancy: the average result per trade after costs and slippage. Also look at the worst day, the longest losing streak, and how results differ between session types and times of day.
If the net expectancy is close to zero, small changes in slippage or costs decide whether the method makes or loses money. That's a fragile edge. Methods worth trading usually show a clear positive net expectancy that survives a more pessimistic slippage assumption.
Practical Example
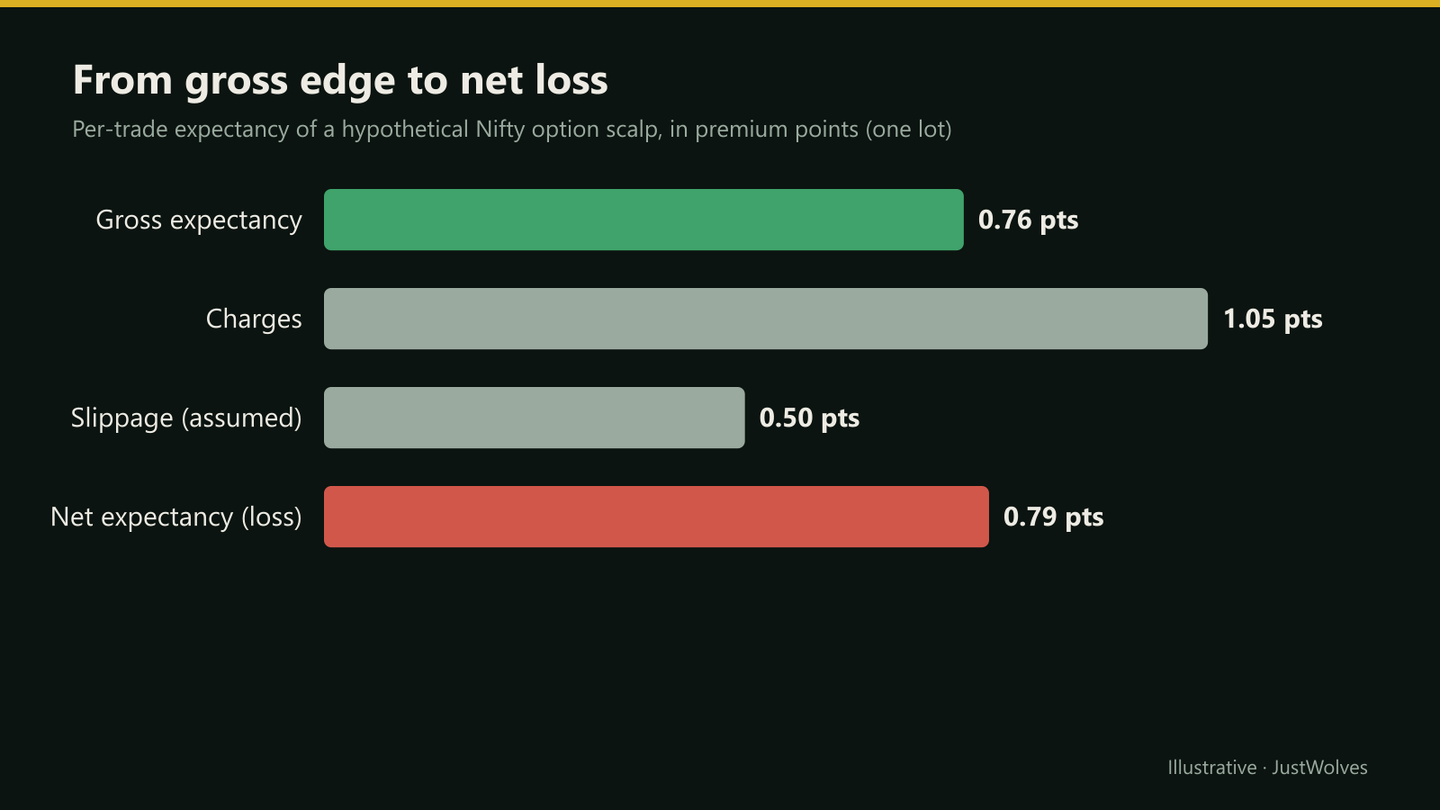
Hypothetically, Aman backtests a Nifty option scalp over 120 trades on one lot. He wins 48% of trades, with average wins of 7 premium points and average losses of 5. Gross expectancy is (0.48 × 7) − (0.52 × 5) = 3.36 − 2.60 = +0.76 points per trade. It looks promising.
He then deducts about 1.05 points of charges per round trip from the brokerage calculator, and half a point of assumed slippage. Net expectancy becomes about −0.79 points per trade, roughly −₹51 per trade on one lot, or about −₹6,200 over the 120 trades. He concludes the method needs larger targets or fewer, higher-quality trades before it's worth paper-trading.
Which Assumptions Change the Result? Our Test
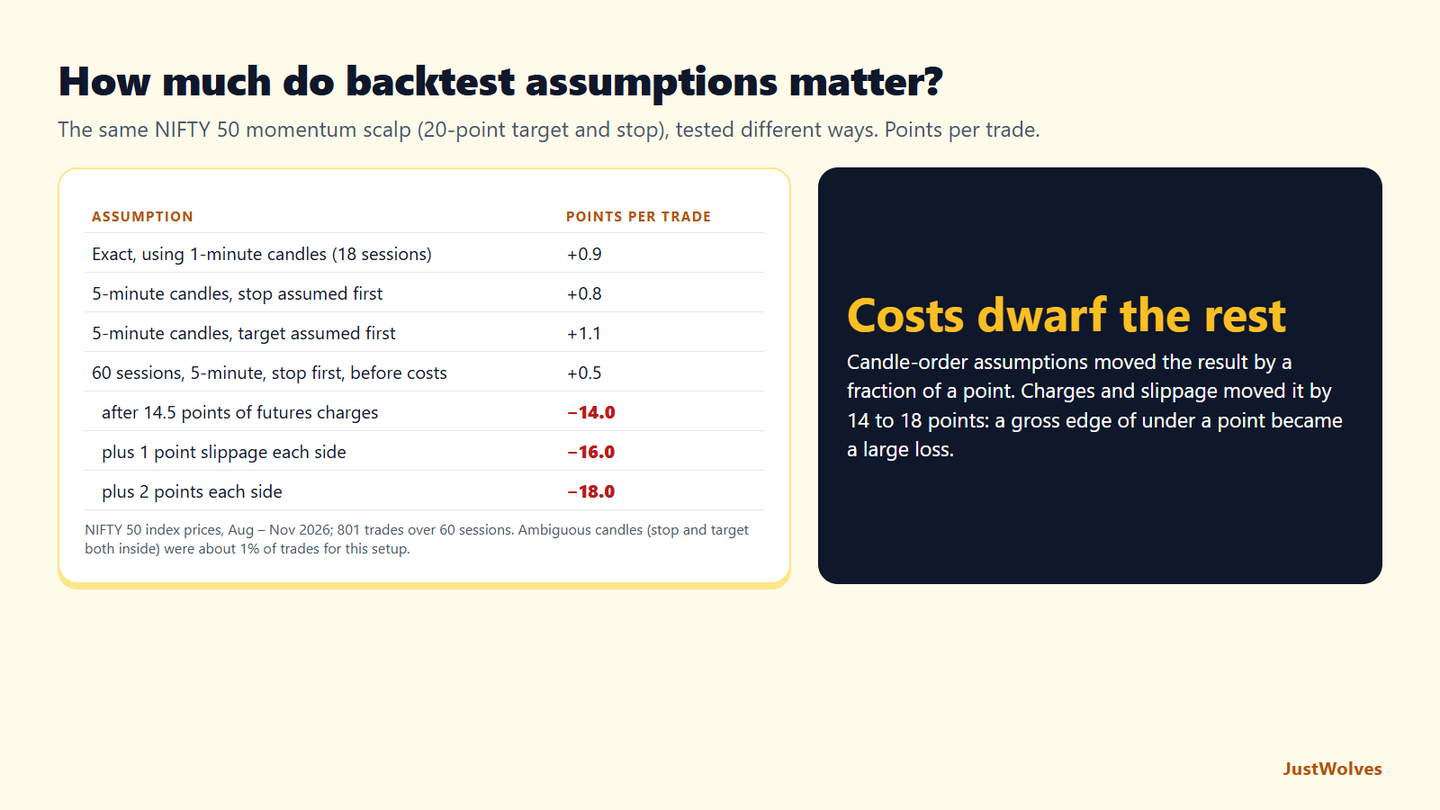
JustWolves ran the same simple NIFTY 50 scalp (a 5-minute close beyond the previous 30 minutes' range, 20-point target and stop) under different backtest assumptions. On 18 sessions we had 1-minute prices, so we could compare the exact result with what a 5-minute backtest would report assuming the stop first or the target first. On 60 sessions of 5-minute prices (801 trades) we then added costs of 14.5 index points per futures round trip and slippage of 1 or 2 points on each side, as this lesson's pessimistic case suggests.
| Assumption | Points per trade |
|---|---|
| Exact, using 1-minute candles (18 sessions, 256 trades) | +0.9 |
| Same trades on 5-minute candles, stop assumed first | +0.8 |
| Same trades on 5-minute candles, target assumed first | +1.1 |
| 60 sessions on 5-minute candles, stop first, before costs (801 trades) | +0.5 |
| after 14.5 points of futures charges | −14.0 |
| plus 1 point of slippage on each side | −16.0 |
| plus 2 points of slippage on each side | −18.0 |
The gross edge was tiny and fragile. Before costs this scalp made under one point per trade, the kind of small positive number that, as this lesson's example shows, looks promising on a chart review.
Candle ambiguity mattered less than expected for this setup. With a 20-point stop and target on 5-minute candles averaging about 24 points, only about 1% of trades had an ambiguous candle, and the stop-first rule lowered the result by a fraction of a point. The rule is still right: with tighter stops relative to the candle size, ambiguous candles become common, and assuming the target first can turn a losing method into a winning one on paper.
Costs and slippage decided everything. Futures charges turned +0.5 points into −14 per trade, and realistic slippage made it worse. Even with the much lower cost of a one-lot option trade, the method lost about 1.5 index points per trade. This is the order of priorities the lesson sets out: costs first, then slippage, then the finer points of the data.
Doubling the slippage estimate, as this lesson's tip suggests, moved the result by another two points. A method that only works with zero slippage is not ready for live trading.
Common Mistakes
- Backtesting gross and adding costs 'later'.
- Assuming targets were hit first within ambiguous candles.
- Drawing levels with hindsight.
- Testing only trending days.
- Changing rules after seeing results, then reporting the best version.
Professional Insight
Experienced traders are often most sceptical of their own best backtests. When a scalping method looks excellent, they look for the error first: a missing cost, an ambiguous candle resolved favourably, a sample chosen after the fact. The methods they eventually trade are usually less impressive on paper but hold up under pessimistic assumptions.
Risk Considerations
- Backtests overstate results almost by default.
- Costs and rates change over time.
- Past performance doesn't guarantee future results.
Important Terminology
| Term | Meaning |
|---|---|
| Gross expectancy | Average result per trade before costs. |
| Net expectancy | Average result per trade after costs and slippage. |
| Inside-candle ambiguity | Not knowing the order of the high and low within a candle. |
| Forward test | Trading rules on paper or small size in live conditions. |
| Hindsight bias | Using information that wasn't available at the time. |
How do I include costs in a scalping backtest?
Deduct a full round-trip cost from every trade, using a brokerage calculator, plus a slippage estimate.
How much slippage should I assume?
Use your measured average if you have one; otherwise a conservative estimate, such as half a premium point per round trip on liquid options, more on stop exits.
Can I backtest scalping on 1-minute candles?
Yes, with care: when a stop and target fall in the same candle, assume the stop was hit.
What result makes a scalping method worth trading?
A clearly positive net expectancy that survives pessimistic cost and slippage assumptions, across different market conditions.
Should I forward-test after backtesting?
Yes. Paper-trade the same rules with live prices and costs for several weeks first.
How much do costs change a scalping backtest?
Usually more than anything else. In our NIFTY 50 test, a simple scalp made +0.5 points per trade before costs; after 14.5 points of futures charges it lost 14 points per trade, and with 2 points of slippage on each side, 18 points.
Should I assume the stop or the target was hit first?
Assume the stop. In our test the difference was small for a 20-point stop on 5-minute candles (about 1% of trades were ambiguous), but with tighter stops ambiguous candles become common, and assuming the target first flatters results.
Practical Exercise
Backtest one method.
Your task
Step 1: Choose one setup
From this course.
Step 2: Test 100 signals
With rules fixed in advance.
Step 3: Calculate gross and net expectancy
With calculator charges and assumed slippage.
Step 4: Rerun pessimistically
With double slippage, and compare.
Check Your Understanding
48% wins averaging 7 points, losses averaging 5. Gross expectancy:
Related Lessons
Previous: Stop-Loss Discipline and Scalping Risk Management. Next: Intraday Trading Psychology. See also How to Backtest a Trading Strategy.