
SMC Scalping: Multi-Timeframe OB, BOS and FVG
JustWolves is an educational platform and is not a SEBI-registered investment advisor. Trading financial instruments involves significant risk of loss and may not be suitable for all investors. Past performance is not indicative of future results. Read our full disclaimer →
What you'll learn
- This method uses a higher timeframe (1-hour or 15-minute) for the setup and a lower one (5 or 1-minute) for the entry
- Higher-timeframe checklist: liquidity sweep, break of structure, a valid order block, and an external liquidity target
- Lower-timeframe checklist: change of character inside the order block, a fair value gap, and a limit entry at its midpoint
- Stops go beyond the lower-timeframe swing that preceded the CHoCH; the first target is 1.5 to 2 times risk, the second the external liquidity
- On Nifty futures, about 14 points of costs per lot make the second target important; check net reward-to-risk
In this article · 14 sections
Smart Money Concepts give scalpers a structured way to combine context and precision: the higher timeframe shows where a setup exists, and the lower timeframe shows exactly when to enter. This lesson turns the concepts from the SMC course into a seven-step scalping checklist, with stop and target rules and a worked Nifty futures example that includes realistic costs. SMC is a framework for reading structure, not a guarantee; every step reduces, but doesn't remove, the chance of failure.
What You Will Learn
- Timeframe pairs for SMC scalping
- The four higher-timeframe conditions
- The three lower-timeframe entry steps
- Stops, two-stage targets and costs
Before You Start
This lesson assumes you know the SMC building blocks: Break of Structure vs Change of Character, Liquidity Sweep vs Displacement, Order Blocks and Fair Value Gap (FVG). Also read Price Action Scalping.
Timeframe Pairs
| Setup chart | Entry chart | Character |
|---|---|---|
| 1-hour | 5-minute | The standard pair; fewer, cleaner setups |
| 15-minute | 1-minute | Faster and noisier; for experienced scalpers |
Apply each checklist to its own timeframe. Mixing them, for example looking for the order block on the 5-minute chart, produces far more and far weaker setups.
Higher-Timeframe Checklist
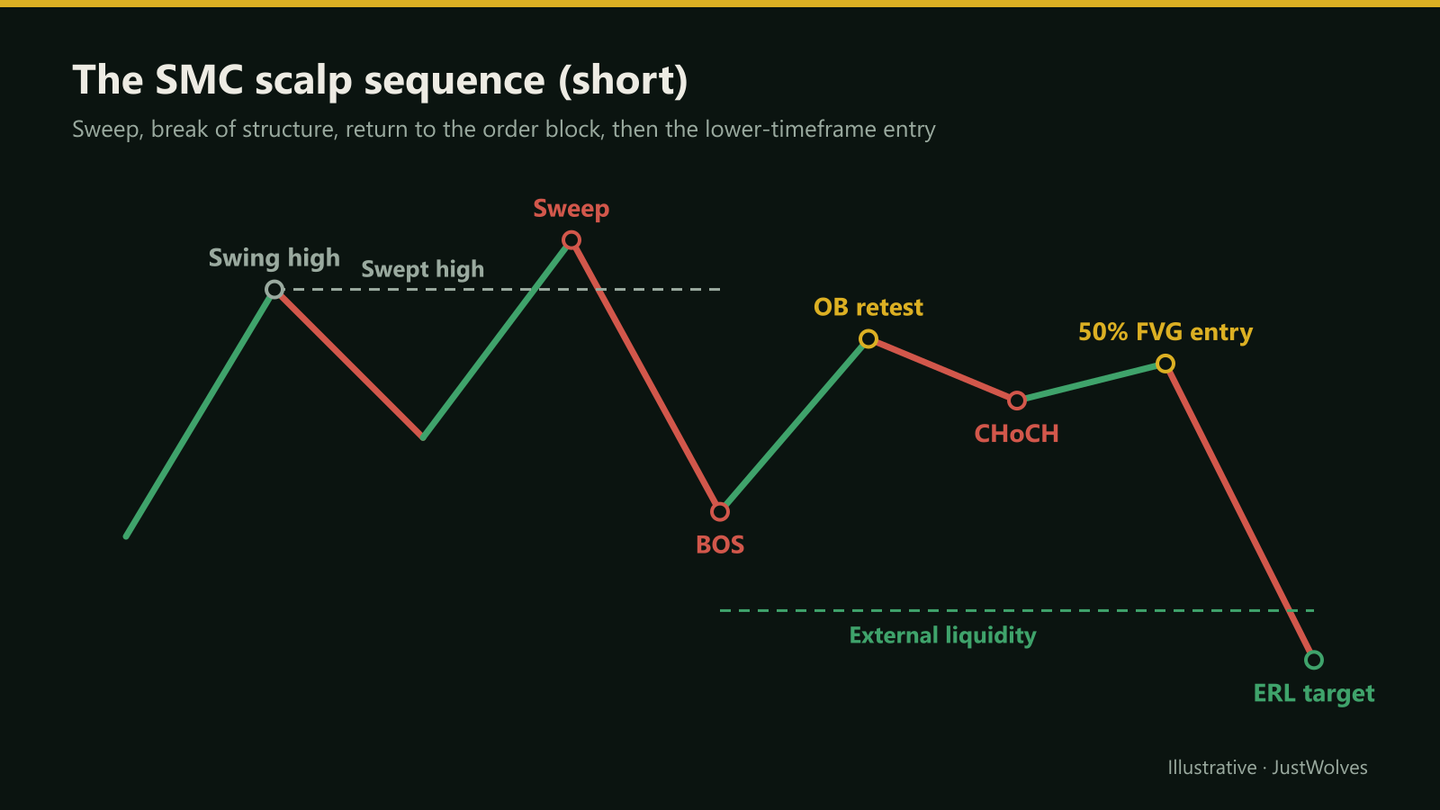
All four must be present (short example)
Step 1: 1. Liquidity sweep
Price trades above a clear swing high, triggering stops, then closes back below it within one to three candles.
Step 2: 2. Break of structure (BOS)
Price then breaks below a significant swing low, confirming sellers have taken control.
Step 3: 3. Valid order block
The last bullish candle before the aggressive drop that caused the BOS, marked from its open to its close; not already retested, and not unusually large.
Step 4: 4. External range liquidity (ERL)
The next significant swing low below, where the trade's final target sits.
For long setups, mirror every step: a sweep below a swing low, a BOS above a swing high, the last bearish candle before the rally as the order block, and the next swing high as the target.
Lower-Timeframe Entry
When price returns to the order block
Step 1: 5. Change of character (CHoCH)
On the entry chart, price has been rising into the bearish order block. The CHoCH is a break below the most recent swing low of that small rise, showing the pullback has ended.
Step 2: 6. Fair value gap (FVG)
The aggressive candle that caused the CHoCH usually leaves a three-candle gap. Mark it.
Step 3: 7. 50% limit entry
Place a sell limit order at the midpoint of the FVG. If price doesn't return to it, there's no trade.
Stops and Targets
- Stop: beyond the entry-chart swing high that formed just before the CHoCH, plus a small buffer.
- Target 1: 1.5 to 2 times the stop distance.
- Target 2: the external range liquidity marked on the setup chart.
Real Prices: Context, Structure, Entry
Ravi's example in this lesson is hypothetical. The chart below shows the same sequence on real NIFTY 50 prices from 5 October 2026: a falling hourly trend, a sweep above a 5-minute high, a break of structure, and a short from a fair value gap, with costs counted.
Real prices: a sweep, a break of structure and a 5-minute FVG short, NIFTY 50, 5 October 2026
Step 1 of 4
Context and a sweep
On the hourly chart, NIFTY 50 had fallen sharply on 1 October 2026 and its hourly closes sat below their 20-hour average. On 5 October the index rallies from the open, and at 9:50 pushes to 22,621.8, above the 9:30 high of 22,595.1, before stalling.
- What to observe
- A run above a nearby high: a liquidity sweep in this lesson's terms.
- Condition
- Now look for a break of structure in the hourly direction.
Practical Example
Hypothetically, on Nifty's 1-hour chart, price sweeps above a swing high, closes back below it, and breaks structure to the downside. Ravi marks the order block and the external liquidity at 24,120. When price returns to the order block, the 5-minute chart shows a CHoCH, and the FVG's midpoint is 24,212. He places a sell limit for two lots of Nifty futures there, with a stop at 24,236 (24 points) above the pre-CHoCH swing high.
He exits one lot at Target 1, 24,164 (48 points), and the other at the external liquidity, 24,120 (92 points). Using the brokerage calculator, charges are about ₹937 per lot. Net, the first lot makes about ₹2,183 and the second about ₹5,043, roughly ₹7,226 in total. Had both lots been stopped, the net loss would have been about ₹4,995. Overall, about 1.45R after costs.
Does Higher-Timeframe Context Help? Our Test
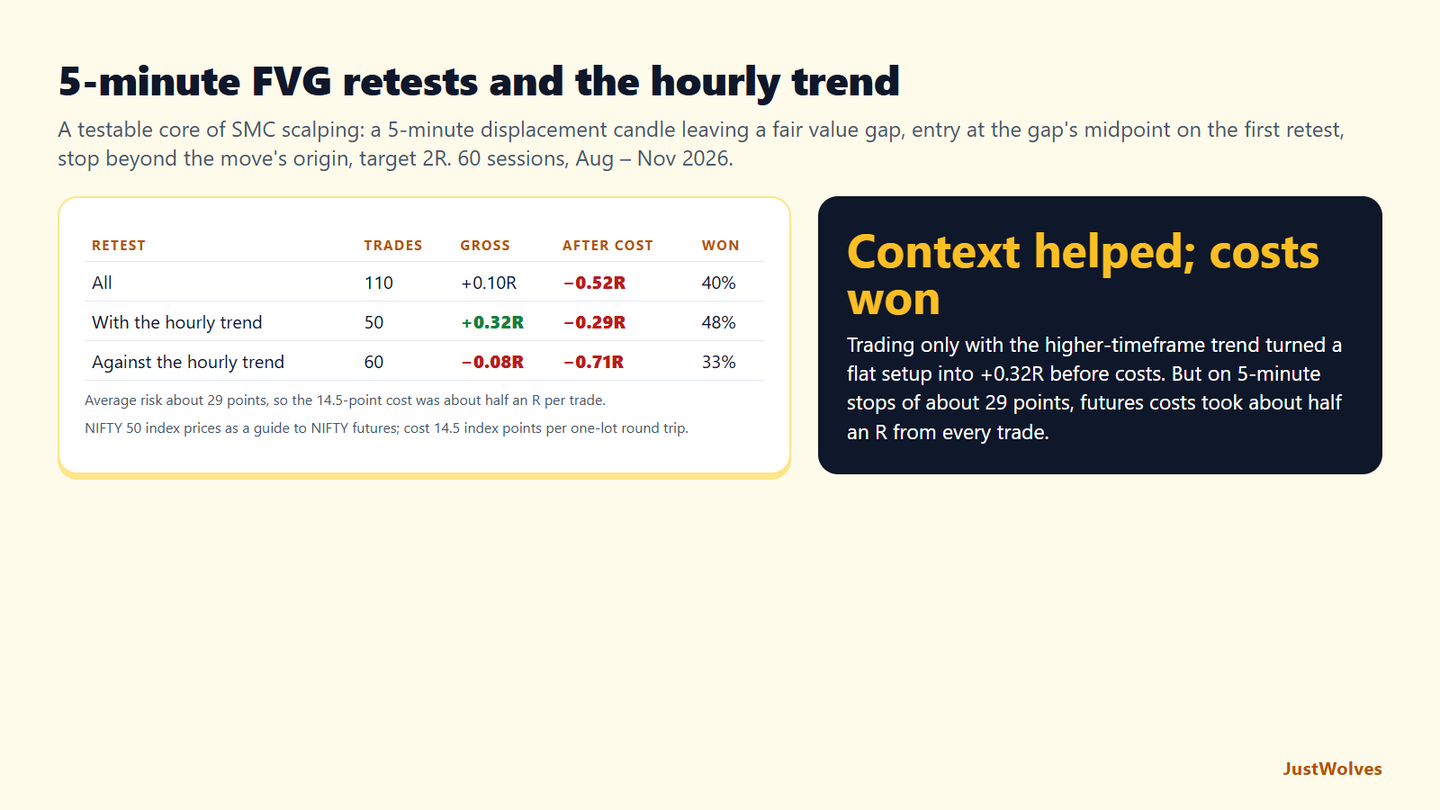
The full seven-step SMC checklist relies on judgement that is hard to code, so JustWolves tested its core on NIFTY 50 5-minute prices for 60 sessions (August to November 2026). Setup: a displacement candle at least 1.5 times the recent average size, leaving a fair value gap. Entry: a limit at the gap's midpoint on the first retest within an hour. Stop: just beyond the origin of the move. Target: 2R. We split trades by whether they agreed with the hourly trend, measured by the last completed hourly close against its 20-hour average. Costs: 14.5 index points per one-lot futures round trip.
| Retest | Trades | Gross | After 14.5-point costs | Won |
|---|---|---|---|---|
| All | 110 | +0.10R | −0.52R | 40% |
| With the hourly trend | 50 | +0.32R | −0.29R | 48% |
| Against the hourly trend | 60 | −0.08R | −0.71R | 33% |
The higher timeframe mattered, as this lesson says. FVG retests in the direction of the hourly trend won almost half the time with a 2R target and averaged +0.32R before costs. The same entries against the hourly trend lost money even before costs. That supports the lesson's insistence on applying each checklist to its own timeframe: the setup chart decides the direction.
Costs turned the gain into a loss. Stops beyond a 5-minute move averaged about 29 points, so the 14.5-point futures cost was about half an R on every trade. This is exactly the warning in this lesson's callout: a trade that looks like 2R before costs is closer to 1R after them, and every loss grows. In futures, only the second target, or execution through options with much smaller costs per trade, leaves room for the edge.
The sample is modest. Fifty trades with the trend is a small number, and our version left out the sweep and order-block steps. Those steps would cut the number of trades further, which is the professional insight in this lesson; whether they improve the result is something to test on your own records.
Common Mistakes
- Skipping steps because the setup 'looks close enough'.
- Order blocks on the entry chart instead of the setup chart.
- Chasing when price doesn't reach the 50% FVG entry.
- Judging futures trades on gross R.
- Ignoring the session: SMC sequences fail more in choppy, low-volume periods.
Professional Insight
Traders who use SMC well tend to say the checklist matters more than any one concept. A sweep without a break of structure, or an order block without a CHoCH on the entry chart, is just a picture. Requiring all seven steps means trading rarely, which is part of why the setups that remain are cleaner.
Risk Considerations
- Subjective identification of sweeps and order blocks.
- Limit entries may be missed in fast moves.
- Futures costs can erase small first targets.
Important Terminology
| Term | Meaning |
|---|---|
| Liquidity sweep | A move beyond a swing point that triggers stops, then reverses. |
| BOS | Break of structure confirming direction. |
| Order block | The last opposing candle before an aggressive move. |
| CHoCH | Change of character: a lower-timeframe structure break against the pullback. |
| ERL | External range liquidity: the next significant swing beyond the structure. |
What is SMC scalping?
Using Smart Money Concepts on short timeframes: a higher-timeframe setup built from structure and liquidity, and a lower-timeframe entry.
Which timeframes are best for SMC scalping?
A common pair is 1-hour for the setup and 5-minute for entry; 15-minute and 1-minute is faster but noisier.
Where is the entry in this method?
A limit order at the 50% level of the fair value gap formed by the CHoCH on the entry chart.
Where does the stop go?
Beyond the entry-chart swing that formed just before the CHoCH, with a small buffer.
Does SMC guarantee results?
No. It's a framework for reading structure; setups still fail, and costs still apply.
Does higher-timeframe trend improve FVG entries?
In our NIFTY 50 test, yes. Over 60 sessions, 5-minute FVG retests in the direction of the hourly trend averaged +0.32R per trade before costs, against −0.08R for those against it.
Are SMC scalps profitable after costs on NIFTY futures?
Not in our simple test. With stops of about 29 points, a 14.5-point futures round-trip cost took about half an R from each trade, leaving even the with-trend FVG entries at −0.29R per trade.
Practical Exercise
Run the checklist.
Your task
Step 1: Scan 20 sessions
Of Nifty on the 1-hour chart.
Step 2: Mark complete HTF setups
All four steps present.
Step 3: Apply the LTF steps
On the 5-minute chart, and record whether the 50% entry filled.
Step 4: Score outcomes
After 14 points of costs per futures lot.
Check Your Understanding
In this method, the order block is marked on:
Related Lessons
Previous: Price Action Scalping. Next: Session-Based Scalping: First Candle Range + FVG. See also Multi-Timeframe SMC Analysis.