
Trending vs Sideways Intraday Sessions
JustWolves is an educational platform and is not a SEBI-registered investment advisor. Trading financial instruments involves significant risk of loss and may not be suitable for all investors. Past performance is not indicative of future results. Read our full disclaimer →
What you'll learn
- Treat 9:15 to 9:30 as an observation window; opening moves are often erratic
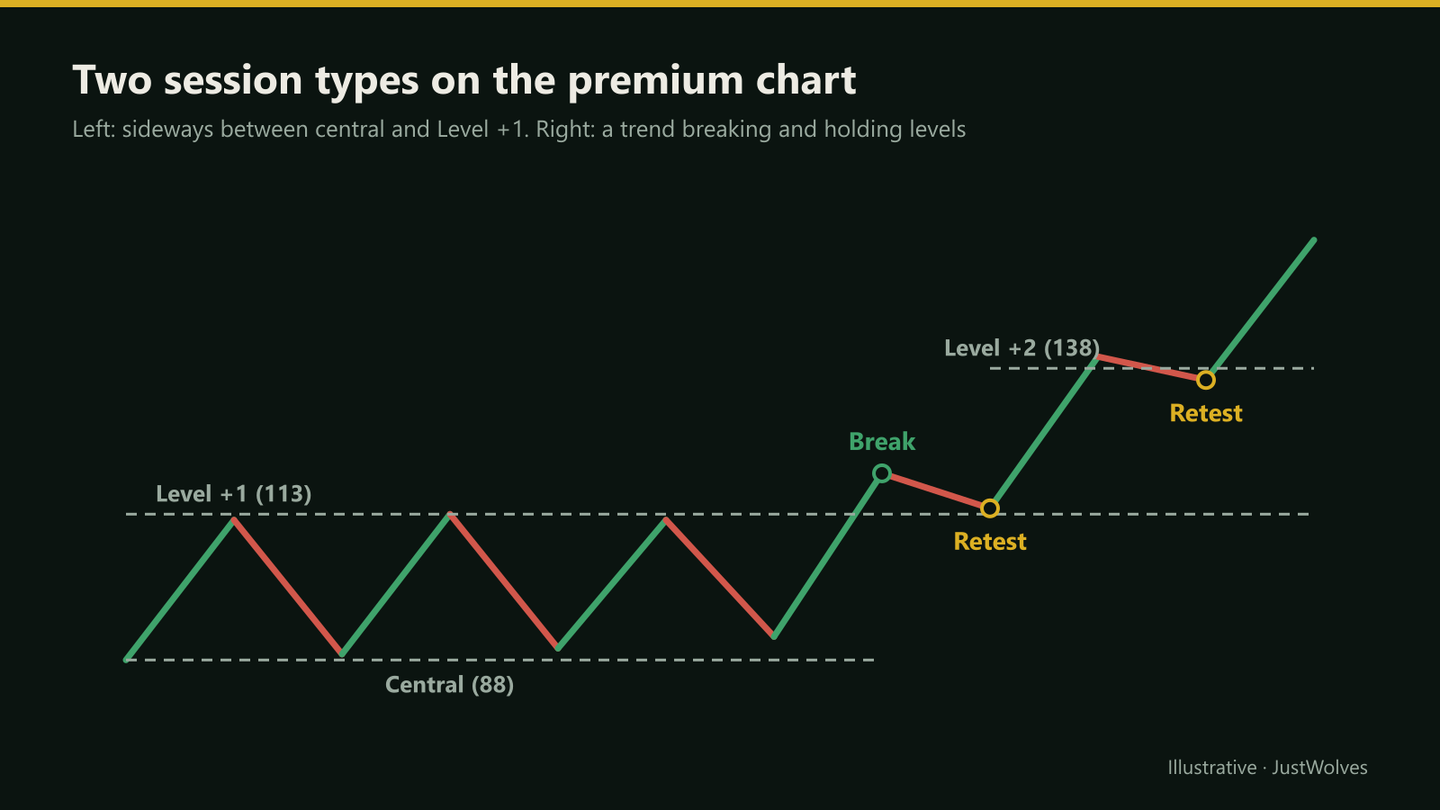
- Trending sessions break levels in sequence and hold them on pullbacks; sideways sessions oscillate between two adjacent levels
- Trending sessions are traded on retests of broken levels; sideways sessions from boundary to boundary
- Sessions change type: a range that breaks and holds becomes a trend, and trends often stall in the afternoon
- Reading call and put premiums together gives extra confirmation of the session's character
In this article · 16 sections
The same level can be a place to buy on one day and a place to sell on another. What decides it is the kind of session the market is having. On a trending day, levels break and become support; on a sideways day, they turn price back again and again. This lesson shows how to classify the session early, how to trade each type with the premium levels from the previous lesson, and how to recognise when the session changes character.
What You Will Learn
- Why the first 15 minutes are for observation
- How to recognise trending and sideways sessions
- Trade structure for each session type
- How to handle sessions that change type
Before You Start
Read Nifty Intraday Key Levels: The Premium Open Method and VWAP for Intraday Traders. The ideas also apply to price levels and VWAP on the index futures chart.
The Observation Window
From 9:15 to about 9:30, option premiums react to overnight news, gaps and opening orders. Moves in this window often reverse quickly, and spreads can be wider. Users of the premium method treat it as observation time: they note where the call and put premiums sit relative to the central level and wait.
By 9:30 to 9:45, the session's character is usually clearer, and entries carry less uncertainty, even if the price is slightly worse.
Classifying the Session
| Time | What you see | Likely session |
|---|---|---|
| 9:30 | Call premium above the central level and holding | Possible bullish trend |
| 9:30 | Call premium below the central level and holding | Possible bearish trend |
| 9:30 | Call premium near the central level | Possibly sideways; confirm by 9:45 |
| 9:45 | Premium has broken Level +1 or −1 and held | Trending |
| 9:45 | Premium rejected at Level +1 or −1, or oscillating around central | Sideways |
Trading a Trending Session
Level retest entry
Step 1: Let the level break
Don't buy the breakout candle itself.
Step 2: Wait for the pullback
Price returns to within a few points of the broken level.
Step 3: Look for rejection
A reversal candle or wick at the level.
Step 4: Enter, stop and target
Enter near the level; stop a few points beyond it; target the next level.
In strong trends, the premium sometimes doesn't retest before moving on. Chasing it usually means a poor entry; waiting for the next level's retest is the more disciplined choice. Don't counter-trade: selling or buying the opposite option at a level because it 'should' reverse is one of the costliest errors on trend days.
Trading a Sideways Session
Boundary fade
Step 1: Identify the boundaries
Two adjacent levels the premium keeps reversing from.
Step 2: Wait for rejection at a boundary
Not the first touch, but a reversal candle there.
Step 3: Enter toward the other boundary
For example, when the call premium is rejected at the upper boundary, the put premium is typically near the lower one, and some traders buy the put.
Step 4: Stop and exit
A few points beyond the boundary; take profit just before the opposite boundary.
When the Session Changes
A sideways session becomes a trend when a boundary breaks and holds, for example two 5-minute closes beyond it. At that point, stop fading that boundary and switch to the trending playbook, looking for the first retest of the broken level.
Trends often lose momentum in the early afternoon, when premiums may start oscillating between two levels. Time decay also reduces option premiums through the day, especially close to expiry, which can make trending moves on the premium chart look weaker than on the index.
Real Prices: When the Session Changes
The chart below shows why this lesson treats classification as provisional. On 21 October 2026, NIFTY 50's first 30 minutes looked like the start of a bullish trend; within an hour, the session had become a down-trend day.
Real prices: a bullish-looking open that became a down-trend day, NIFTY 50, 21 October 2026
Step 1 of 4
A bullish-looking open
NIFTY 50 gains about 0.6% at the open on 21 October 2026 and rises to 23,120.9 by 9:45. The first 30 minutes close near their high with a strong body: by the simple test in our data section, a trend-like bullish open.
- What to observe
- The 9:30–9:45 read says "possible bullish trend".
- Condition
- This lesson: the 9:45 decision is the most important of the day.
Reading Both Premiums Together
Because the call and put premiums move in opposite directions as the index moves, users of the method watch both charts with the same levels. A call premium breaking Level +1 while the put premium breaks Level −1 is a stronger signal than either alone. When both premiums stall at levels at the same time, the session is often balancing.
Practical Example
Hypothetically, using the ladder from the previous lesson (central 88, interval 25), by 9:45 the call premium has been rejected twice near 113 and the put premium has bounced twice from about 63. Kiran classifies the session as sideways. On the third rejection of the call at 113, the put premium sits at 64 and forms a bullish candle.
He buys one put lot (65 units) at 64, with a stop at 59 below Level −1, and a target of 86, just before the central level. Gross, 5 points of risk (₹325) for 22 of reward (₹1,430). Charges from the brokerage calculator are about ₹60 on a win and ₹56 on a loss: net, about +₹1,370 or −₹381, roughly 3.6R.
How Reliable Is an Early Read? Our Test
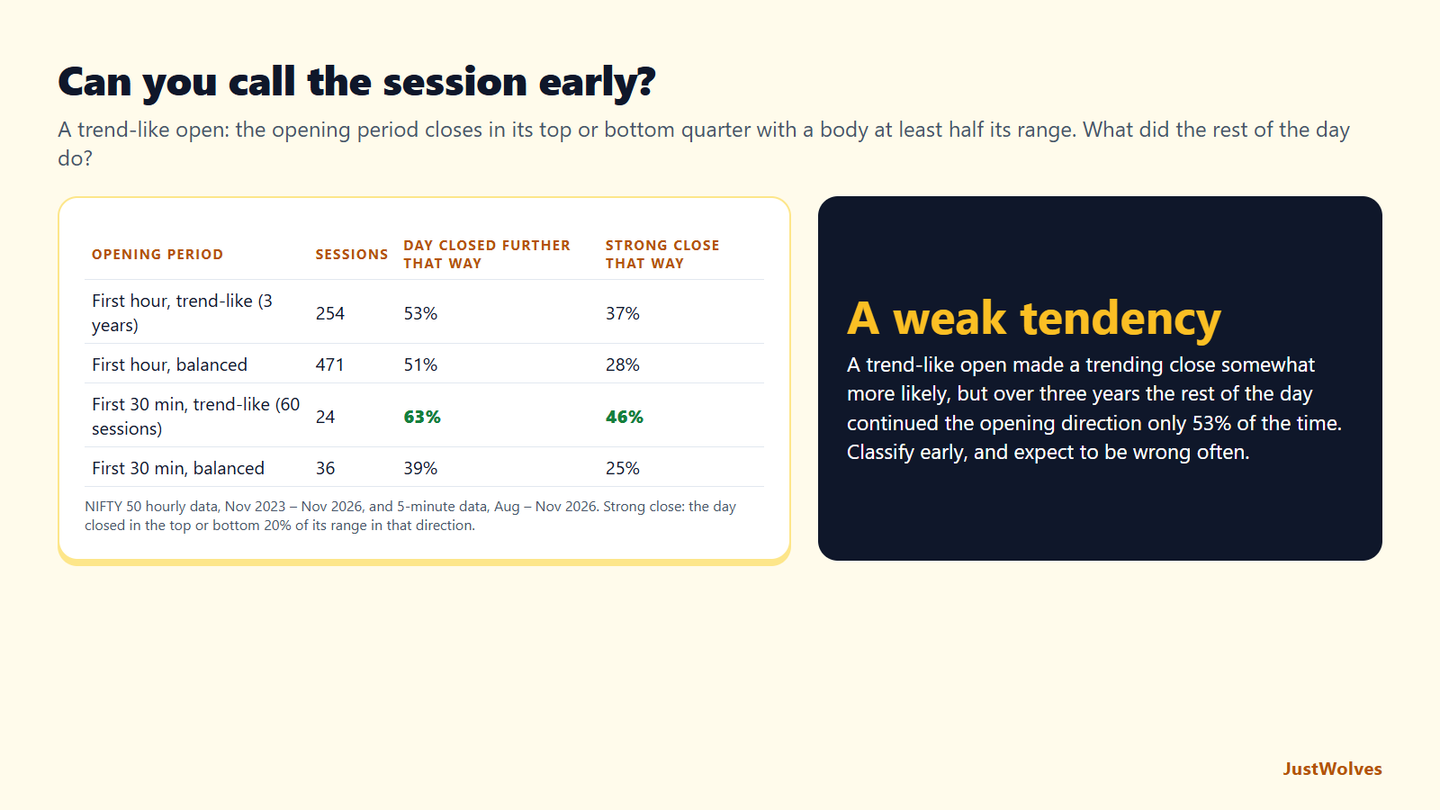
JustWolves tested a simple, objective version of the early classification on NIFTY 50: three years of hourly prices (725 sessions, November 2023 to November 2026) using the first hour, and 60 sessions of 5-minute prices (August to November 2026) using the first 30 minutes. A trend-like open closed in the top or bottom quarter of its range with a body at least half the range; the rest were balanced. We then checked whether the day closed further in the opening direction, and whether it closed in the strongest 20% of its range in that direction, a typical trend-day close.
| Opening period | Sessions | Day closed further in that direction | Strong close in that direction |
|---|---|---|---|
| First hour, trend-like (3 years) | 254 | 53% | 37% |
| First hour, balanced | 471 | 51% | 28% |
| First 30 minutes, trend-like (60 sessions) | 24 | 63% | 46% |
| First 30 minutes, balanced | 36 | 39% | 25% |
A trend-like open helped, but only a little. Over three years, days with a trend-like first hour closed further in that direction 53% of the time, barely more than balanced days (51%), though they were more likely to finish with a strong trend-day close (37% against 28%). In the recent 60-session sample the difference was larger, 63% against 39%, but 24 sessions is a small number.
The read is often wrong, so the change rule matters. Even after a trend-like open, nearly half of days did not continue that way, as on 21 October 2026 above. That makes the section in this lesson on recognising a change of character, two closes beyond a boundary, at least as important as the initial call.
Use the classification as a starting hypothesis. The professional insight in this lesson suggests recording your 9:45 call and the day's actual character. Our data suggests what such a record is likely to show: a modest edge from a good early read, and many days where the session changed and the trader had to change with it.
Common Mistakes
- Trading before 9:30 on the opening noise.
- Fading a trending session.
- Buying breakouts instead of waiting for retests.
- Not switching playbooks when a range breaks.
- Ignoring time decay late in the day near expiry.
Professional Insight
Experienced intraday traders often say the most valuable decision of the day is made around 9:45: which playbook to use. Get it right and the levels do the rest; get it wrong and even good entries fail. Many keep a simple record of their 9:45 call and the day's actual character, and use it to improve the classification over time.
Risk Considerations
- Misclassification early in the session.
- Sudden news turning a range into a trend.
- Time decay eroding option premiums.
Important Terminology
| Term | Meaning |
|---|---|
| Observation window | The first minutes after the open, used for watching rather than trading. |
| Trending session | A day when levels break in sequence and hold on retests. |
| Sideways session | A day when premiums oscillate between two levels. |
| Level retest entry | Entering on a pullback to a broken level in a trend. |
| Boundary fade | Entering at a range edge towards the opposite edge. |
How do I know if the intraday session is trending?
Premiums break levels in sequence and hold them on pullbacks; on the index, price holds one side of a sloping VWAP.
Should I trade in the first 15 minutes?
Many intraday traders don't; opening moves often reverse and spreads can be wider.
How do I trade a sideways session?
From one boundary level towards the other, after a rejection, with a stop just beyond the boundary.
What if a sideways session breaks out?
Stop fading that boundary and switch to retest entries in the new direction.
Why watch both call and put premiums?
They move in opposite directions, so breaks or stalls on both at once give stronger confirmation.
Can you tell a trend day from the first hour?
Only weakly, in our NIFTY 50 data. Over three years, a trend-like first hour was followed by a strong close in the same direction 37% of the time, against 28% after a balanced first hour, and the day closed further in that direction only 53% of the time.
What should I do when the session changes character?
Switch playbooks. This lesson uses two 5-minute closes beyond a boundary as the sign; after that, stop fading that side and look for the first retest of the broken level. On 21 October 2026, NIFTY 50 did exactly this after a bullish-looking open.
Practical Exercise
Classify sessions.
Your task
Step 1: Build the ladder daily
For 20 sessions.
Step 2: Make a 9:45 call
Trending up, trending down or sideways.
Step 3: Record the actual character
At 1 pm and at the close.
Step 4: Measure accuracy
And note what misled you on wrong calls.
Check Your Understanding
The 9:15–9:30 window is best used for:
Related Lessons
Previous: Nifty Intraday Key Levels: The Premium Open Method. Next module: News-Event Risk for Intraday Traders. See also Range, Breakout and Pullback Scalping.