
VWAP for Intraday Traders
JustWolves is an educational platform and is not a SEBI-registered investment advisor. Trading financial instruments involves significant risk of loss and may not be suitable for all investors. Past performance is not indicative of future results. Read our full disclaimer →
What you'll learn
- VWAP is the volume-weighted average price of the session so far, reset each day
- Price above a rising VWAP suggests buyers are in control for the session; below a falling VWAP, sellers
- Common uses: a session bias filter, a pullback level in trends, and a reclaim or loss signal
- Indices have no volume, so traders use VWAP on index futures or on liquid stocks
- VWAP works poorly on choppy, range-bound days, when price crosses it repeatedly
In this article · 15 sections
VWAP, the volume-weighted average price, is one of the few indicators that both institutions and intraday traders watch. Large buyers use it to judge whether they paid a fair price for the day; intraday traders use it to judge who's in control of the session. This lesson explains how VWAP is calculated, why it matters, three practical ways to use it, and the market conditions where it stops being useful.
What You Will Learn
- How VWAP is calculated
- Why institutions and intraday traders watch it
- Three practical VWAP uses
- When VWAP is unreliable
Before You Start
Read Sessions and Timeframes and Volume Analysis.
How VWAP Is Calculated
For each candle, take the typical price, (high + low + close) ÷ 3, and multiply it by that candle's volume. Add these up from the start of the session, and divide by the total volume so far. The result is the average price paid per unit traded today, weighted by how much traded at each price.
VWAP resets at the start of each session. Early in the day it moves a lot, because few candles have been included; later it moves slowly, because each new candle is a small part of the total.
| Candle | Typical price | Volume | Price × volume |
|---|---|---|---|
| 1 | 24,110 | 300 | 72,33,000 |
| 2 | 24,130 | 200 | 48,26,000 |
| 3 | 24,150 | 100 | 24,15,000 |
| Total | 600 | 1,44,74,000 |
VWAP = 1,44,74,000 ÷ 600 ≈ 24,123.3. Because most volume traded near 24,110, VWAP sits closer to that price than a simple average of the three (24,130) would.
Why VWAP Matters
Institutions executing large orders often aim to buy below VWAP or sell above it, and their execution quality is frequently measured against it. That creates real buying and selling interest near the line.
For intraday traders, VWAP summarises the session: if price is above VWAP, the average participant who bought today is in profit, and buyers have generally been in control. Below VWAP, the reverse.
Three Ways to Use VWAP
| Use | How it works |
|---|---|
| Bias filter | Prefer longs above a rising VWAP and shorts below a falling one |
| Pullback level | In a trending session, buy pullbacks to VWAP that hold, with a stop below the pullback low |
| Reclaim or loss | A move back above VWAP after trading below it (or the reverse) can signal a shift in control |
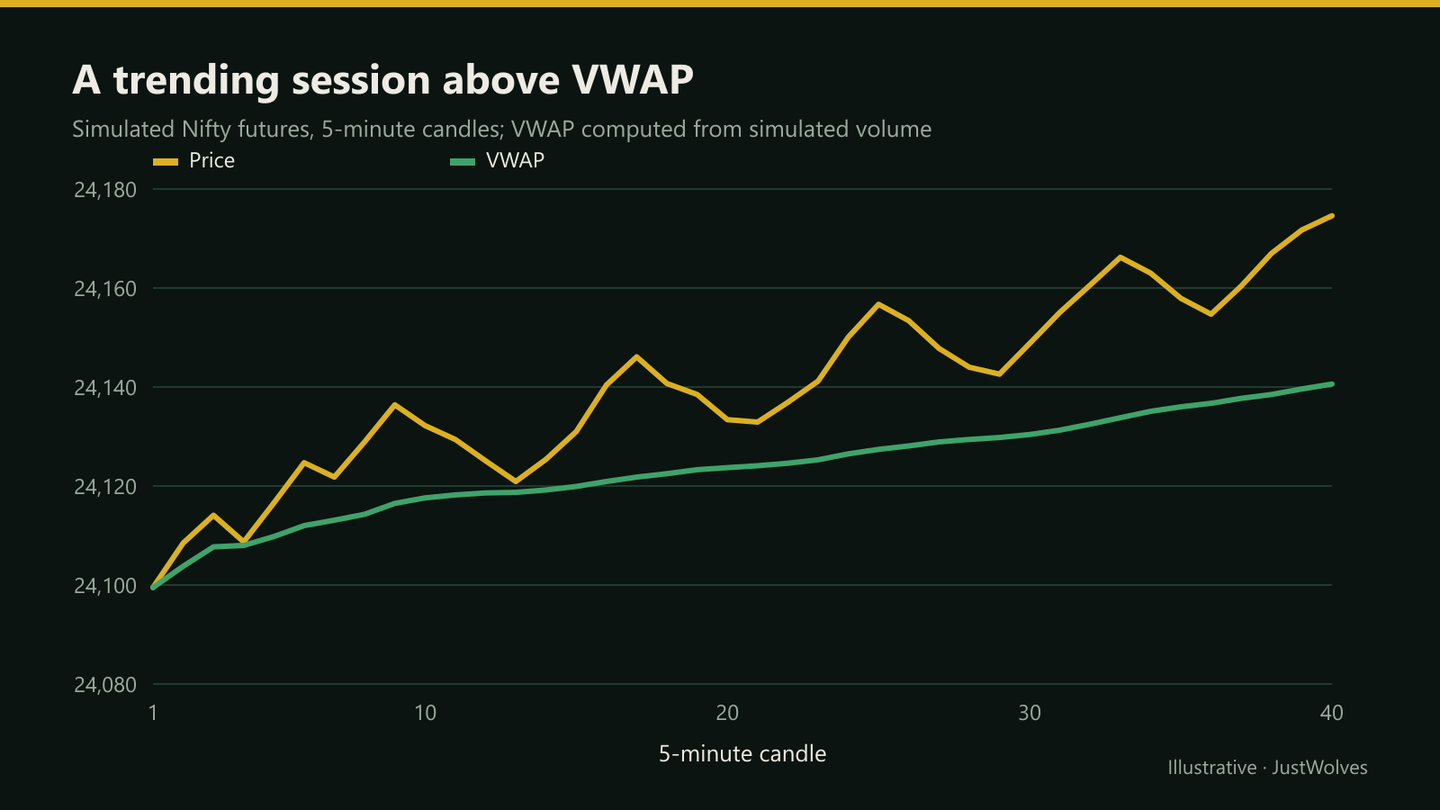
Real Prices: A Clean VWAP Session
The example in this lesson uses hypothetical Nifty futures prices. The chart below shows a real VWAP session on ICICI Bank on 8 September 2026: price below VWAP from the first minutes, no crosses all morning, and a pullback to VWAP that offered a short with a tight stop.
Real prices: a trend day below VWAP and a pullback short, ICICI Bank, 8 September 2026
Step 1 of 4
Below VWAP from the start
ICICI Bank opens at ₹1,423.9 on 8 September 2026 and slips steadily. By the 9:20 candle it is below VWAP, and it stays below all morning: by 10:10 the price is ₹1,412.4 with VWAP at ₹1,415.1.
- What to observe
- Sellers in control: this lesson's first use of VWAP, as a bias.
- Condition
- A VWAP filter rules out longs today.
Index vs Futures vs Stocks
The Nifty 50 and Bank Nifty indices have no traded volume of their own, so VWAP on the index chart either isn't available or is meaningless. Traders apply VWAP to index futures, whose volume reflects real trading, or to liquid individual stocks. Many option traders use the futures VWAP as their reference, even when trading options.
Bands and Anchored VWAP
Many platforms can plot bands at one or two standard deviations above and below VWAP. On range days, price often oscillates between the bands; on trend days, it can ride the outer band. Anchored VWAP starts the calculation from a chosen point, such as a gap open or a major intraday low, instead of 9:15, showing the average price paid since that event. Both are refinements; the basic session VWAP remains the most widely watched.
Practical Example
Hypothetically, Nifty futures open at 24,100 and trend higher. By 10:20, price is 24,135 and VWAP is 24,119. Price pulls back over three 5-minute candles to 24,121, just above VWAP, and forms a bullish candle closing at 24,126.
Leena buys one lot at 24,127 with a stop at 24,112, below the pullback low and VWAP, risking 15 points. Because one-lot futures charges are about 14 points, she targets the morning high plus some room, 24,170, a 43-point gross gain. Net of charges, that's about 29 points of reward against about 29 points of loss if stopped, roughly 1:1. So she trades the same setup with a near-the-money call instead, keeping the index levels for her stop and target; there, charges are about 1 premium point per lot.
Does VWAP Help Scalpers? Our Test
JustWolves tested this lesson's two main uses of VWAP on 5-minute prices with volume for 10 liquid NSE stocks, about 58 sessions each from August to November 2026. As a filter: a simple momentum scalp (a close beyond the previous 30 minutes' high or low, stop 1 ATR, target 1.5R), split by whether it traded with VWAP (longs above, shorts below) or against it. As an entry: a VWAP pullback, after at least an hour on one side of a sloping VWAP, a candle touching VWAP and closing back in the trend direction, with a stop beyond the candle and a 2R target. We also split pullbacks by how many times price had crossed VWAP by 11:00. Costs: 0.06% of the trade value per round trip.
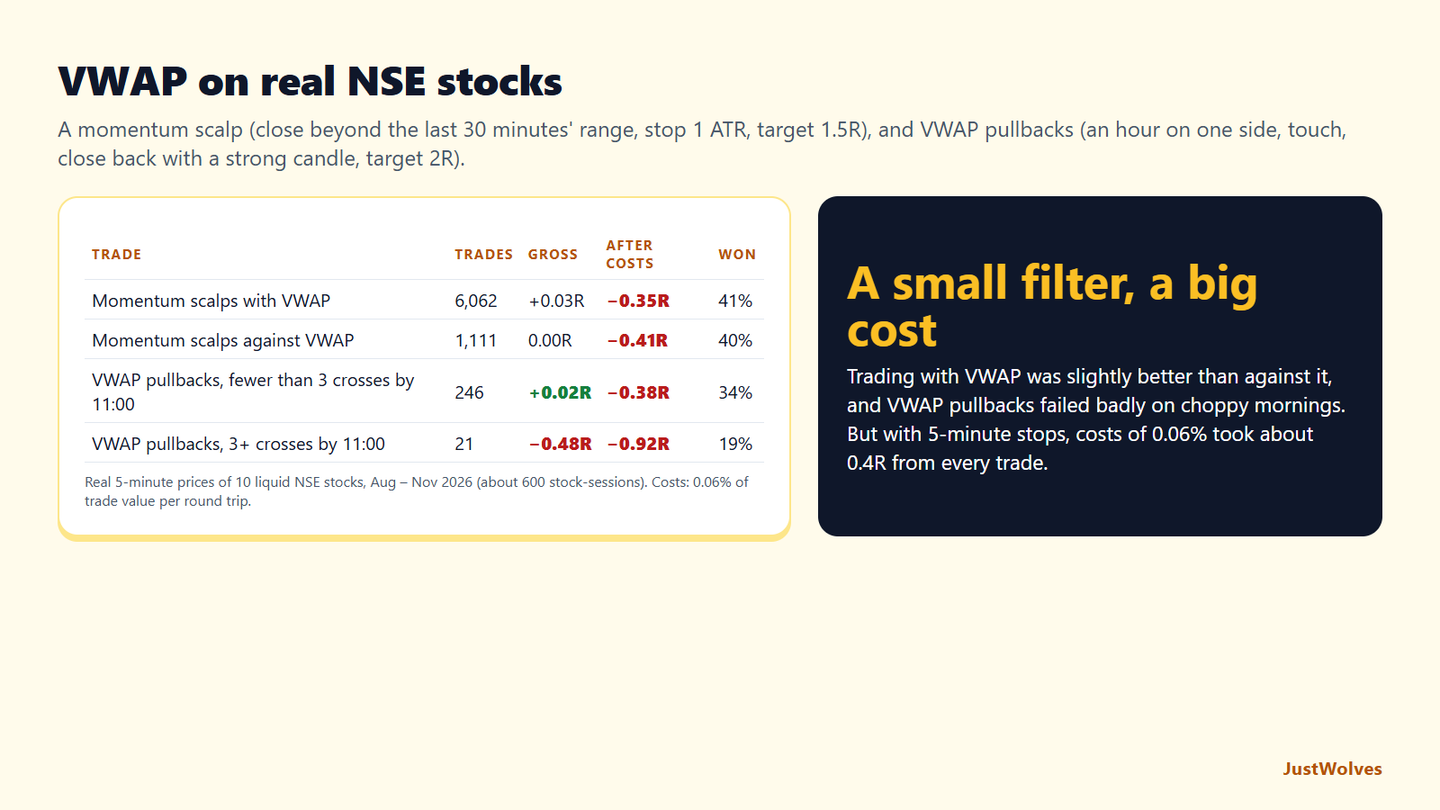
| Trade | Trades | Gross | After costs | Won |
|---|---|---|---|---|
| Momentum scalps with VWAP | 6,062 | +0.03R | −0.35R | 41% |
| Momentum scalps against VWAP | 1,111 | 0.00R | −0.41R | 40% |
| VWAP pullbacks, fewer than 3 VWAP crosses by 11:00 | 246 | +0.02R | −0.38R | 34% |
| VWAP pullbacks, 3 or more crosses by 11:00 | 21 | −0.48R | −0.92R | 19% |
As a filter, VWAP helped only slightly. Momentum scalps in the direction of VWAP did a little better than those against it, which supports the professional insight in this lesson, but the difference was small. Most signals were already on the VWAP side, because a 30-minute breakout usually takes price across VWAP.
The choppy-day warning was the strongest finding. VWAP pullbacks on mornings with three or more VWAP crosses by 11:00 lost almost half an R per trade before costs and won only 19% of the time, though there were only 21 of them. On cleaner mornings, the same setup roughly broke even before costs. This is the callout in this lesson, measured: when price keeps crossing VWAP, stop treating VWAP as a signal.
Costs were the real obstacle. A 5-minute stop on a large stock is often only 0.15% to 0.25% of the price, so 0.06% of costs took about 0.4R from every trade. None of the VWAP versions made money after costs in this period. VWAP is most useful as context for deciding which side to trade, and when not to trade; the entries still need targets large enough to cover costs.
Common Mistakes
- Using VWAP on the index chart, which has no volume.
- Trading every VWAP cross on choppy days.
- Ignoring the trend and fading strong moves away from VWAP.
- Tight stops right at VWAP, where price often probes.
- Forgetting costs on small VWAP scalps in futures.
Professional Insight
Many experienced intraday traders use VWAP mainly as a filter: they simply don't buy below it or short above it. That one rule removes a large share of counter-trend trades. They treat specific VWAP entries as a second layer, used only on days when price has clearly respected the line.
Risk Considerations
- Early VWAP is unstable in the first candles.
- Range days produce repeated false crosses.
- News can move price far from VWAP quickly.
Important Terminology
| Term | Meaning |
|---|---|
| VWAP | Volume-weighted average price of the session. |
| Typical price | (High + low + close) ÷ 3 for a candle. |
| VWAP reclaim | Price moving back above VWAP after trading below it. |
| Bias filter | A rule allowing trades only in one direction. |
| Anchored VWAP | A VWAP calculated from a chosen starting point instead of the open. |
What is VWAP in trading?
The volume-weighted average price of the session so far, resetting each day.
How do I use VWAP for intraday trading?
As a bias filter, a pullback level in trends, or a signal when price reclaims or loses it.
Why doesn't VWAP work on the Nifty index chart?
The index has no traded volume. Use Nifty futures instead.
Is VWAP good for scalping?
It helps with direction and levels, but costs still apply; futures scalps need moves well above about 14 points per lot.
When does VWAP fail?
On range-bound days when price crosses it repeatedly.
Does trading in the direction of VWAP improve results?
Slightly, in our test. On 10 liquid NSE stocks, 5-minute momentum scalps in the VWAP direction averaged +0.03R before costs, against 0.00R for those against VWAP. The bigger benefit was avoiding VWAP pullback trades on choppy mornings.
Can I use VWAP on the NIFTY 50 chart?
Not meaningfully. The index has no traded volume, so VWAP needs NIFTY futures or individual stocks. Our test used 5-minute prices and volume for 10 liquid NSE stocks.
Practical Exercise
Study VWAP behaviour.
Your task
Step 1: Add VWAP
To a 5-minute Nifty futures chart.
Step 2: Watch ten sessions
Count how often price crossed VWAP each day.
Step 3: Classify days
Trending (few crosses) or choppy (many).
Step 4: Test pullbacks
On trending days, did pullbacks to VWAP hold?
Check Your Understanding
VWAP resets:
Related Lessons
Previous module: Sessions and Timeframes. Next: RSI and Momentum Scalping. See also Volume Analysis.