
Price Action Scalping
JustWolves is an educational platform and is not a SEBI-registered investment advisor. Trading financial instruments involves significant risk of loss and may not be suitable for all investors. Past performance is not indicative of future results. Read our full disclaimer →
What you'll learn
- Price action scalping reads candles and structure directly, without indicators
- Signals only matter at levels: VRZs, the previous day's high and low, VWAP or the opening range
- Four common patterns: rejection wicks, inside-bar breaks, two-leg pullbacks and failed breakouts
- Stops go beyond the pattern's extreme; targets go to the next level
- Bank Nifty option lots are smaller, so costs per premium point are higher than on Nifty
In this article · 14 sections
Many experienced scalpers trade with almost nothing on the chart: price, a few levels and perhaps VWAP. They read what each candle shows about buyers and sellers at the levels that matter. This lesson covers four price action patterns that work on short timeframes, why they only count at levels, and how to place stops and targets with costs in mind.
What You Will Learn
- Why location matters more than the pattern
- Four price action scalping patterns
- Stops and targets for each
- How costs differ between Nifty and Bank Nifty options
Before You Start
Read EMA Scalping with Supply, Demand and Momentum Candles, Price Rejection and Inside Bars and Outside Bars.
Location First
A hammer in the middle of nowhere on a 1-minute chart means very little; there are dozens of them every session. The same hammer at a fresh VRZ Low, the previous day's low or VWAP in an uptrend means much more, because it shows buyers defending a level other traders are watching.
So the first step is the same as in every intraday method: mark your levels before the session, and only read candles when price is at one of them.
Four Patterns
| Pattern | What you see | Entry | Stop |
|---|---|---|---|
| Rejection wick | A long lower wick at support, closing near the high | Break of the candle's high | Below the wick |
| Inside-bar break | A small candle within the previous candle's range, at a level | Break of the inside bar's high | Below the inside bar or mother bar low |
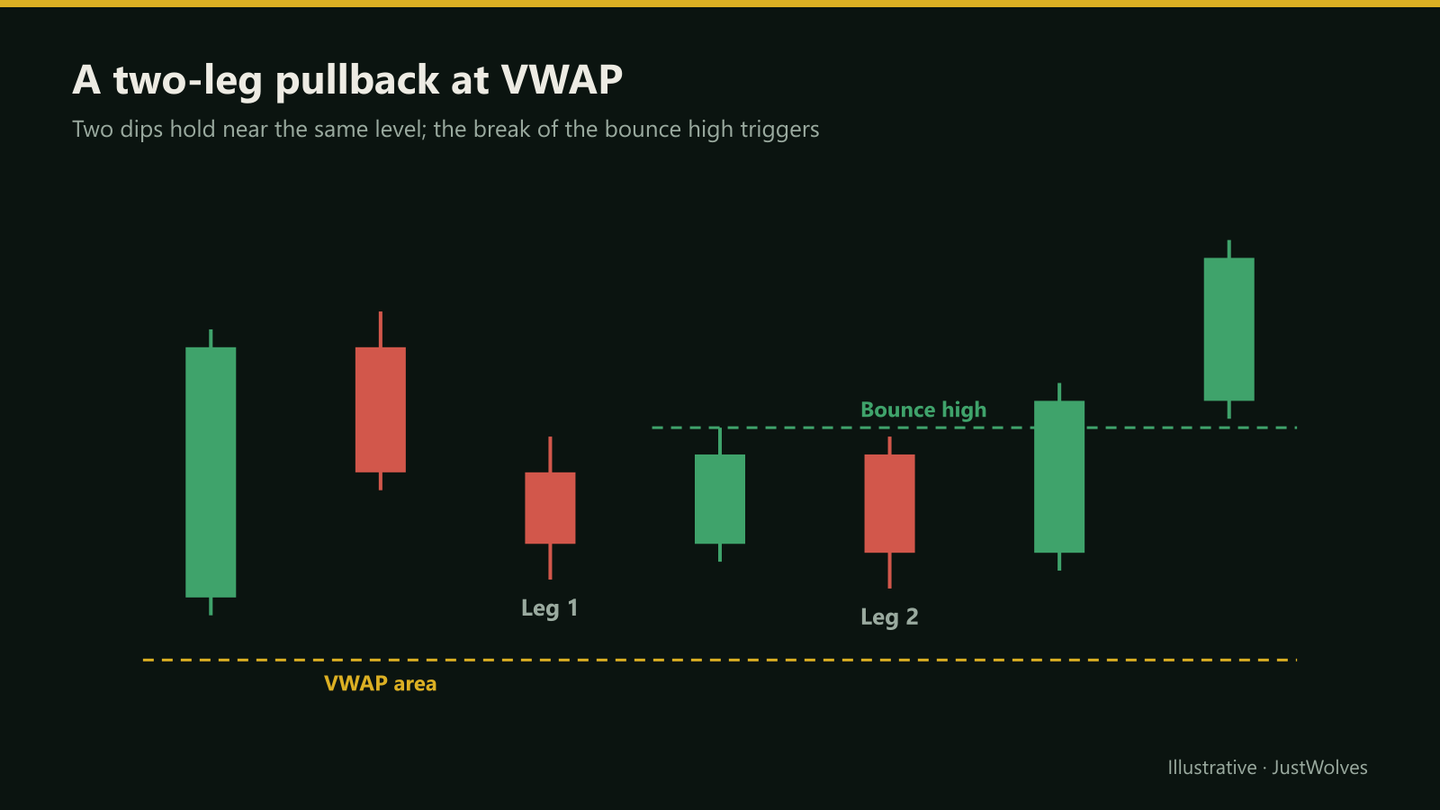
| Two-leg pullback | In an up move, a dip, small bounce, second dip holding near the first | Break above the bounce high | Below the second leg's low |
| Failed breakdown | Price breaks below support, then closes back above it | Close back above, or break of that candle's high | Below the failed breakdown's low |
Real Prices: A Hammer at a Level
Divya's example in this lesson is hypothetical. The chart below shows the same idea on real State Bank of India prices from 26 October 2026: a rejection candle at the previous day's low, close to VWAP, entered on a break of its high with a stop below the wick.
Real prices: a hammer at the previous day's low, State Bank of India, 26 October 2026
Step 1 of 4
A level that matters
State Bank of India drifts lower through the morning of 26 October 2026, from about ₹955 to ₹950.8, close to the previous session's low of ₹950.5 and to VWAP, about ₹951.
- What to observe
- Two levels other traders are watching, in the same place.
- Condition
- This lesson: location first, pattern second.
Pattern Notes
- Rejection wicks are strongest when the wick probes beyond the level and the body closes back well inside.
- Inside bars show a pause; the break direction matters more than the bar itself. Breaks with the session trend are more reliable.
- Two-leg pullbacks are common in trending sessions; many traders regard the second leg as where weak holders give up.
- Failed breakdowns trap sellers below support, and their exits can fuel a fast move back up.
Targets
Targets come from the next level: the session high or low, the next VRZ, VWAP from the other side, or the opening range boundary. If the next level is too close to cover costs and give a reasonable reward-to-risk, skip the trade.
Some scalpers use a fixed multiple of risk instead. Whatever the method, the target should be decided before entry.
Practical Example
Hypothetically, Bank Nifty is trending up above VWAP. At 10:50, it dips to the previous day's high, which is also a fresh VRZ, and forms a 3-minute rejection wick. Divya buys one lot (30 units) of a near-the-money call at 310 on the break of that candle's high, with a stop at 299 based on the option's price below the wick, and a target of 328 at the morning high.
Gross, she risks 11 points (₹330) to make 18 (₹540), about 1.6R. Charges from the brokerage calculator are about ₹70 on a win and ₹69 on a loss, so the net outcome is about +₹470 or −₹399, about 1.2R. On a lot of 30, costs take a noticeably larger share than on a Nifty lot.
Does Location Matter? Our Test
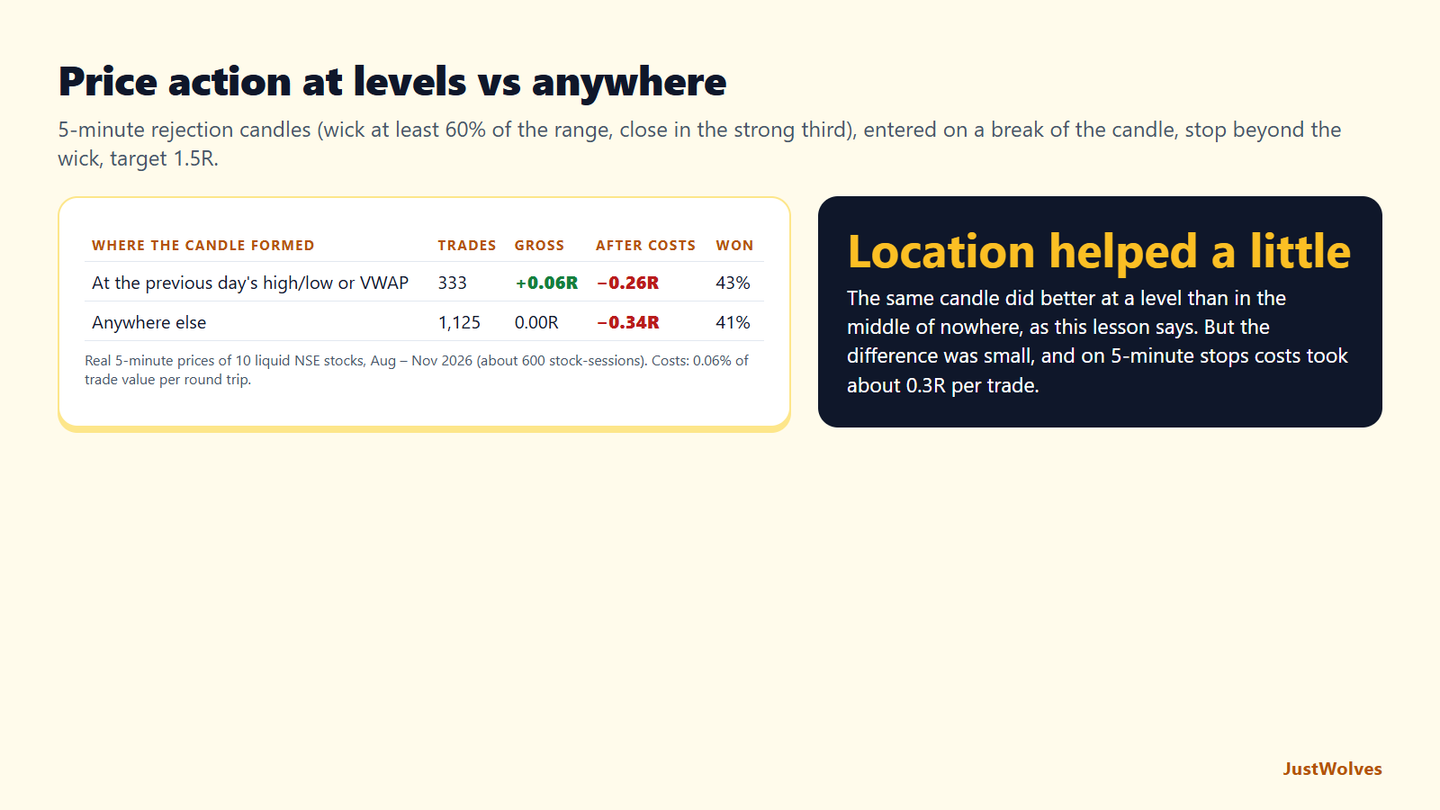
JustWolves tested this lesson's central claim, that a pattern only counts at a level, on 5-minute prices for 10 liquid NSE stocks, about 58 sessions each from August to November 2026. We found every rejection candle: at least average size, a wick of at least 60% of its range, and a close in the strong third. Each was entered on a break of its high (or low) in the next candle, with a stop just beyond the wick and a 1.5R target, and split by whether it formed at a level (the previous day's high or low, or VWAP) or anywhere else. Costs: 0.06% of trade value per round trip.
| Where the candle formed | Trades | Gross | After costs | Won |
|---|---|---|---|---|
| At the previous day's high/low or VWAP | 333 | +0.06R | −0.26R | 43% |
| Anywhere else | 1,125 | 0.00R | −0.34R | 41% |
Location helped, modestly. The same rejection candles did better at a level than in the middle of the chart: +0.06R against breakeven before costs, and a slightly higher win rate. That supports this lesson's first section. Most rejection candles, three in four, formed away from any level, which is why traders who act on every pattern take so many trades.
The edge was smaller than the costs. On 5-minute stops, often only a few rupees, costs of 0.06% took about 0.3R per trade, more than the advantage of the level. The tip in this lesson about choosing instruments with low cost per point applies here too: a price action scalp needs a target far enough away to leave room after costs, which is the point of this lesson's targets section.
Context beyond the level matters too. Our test used only two types of level and no session or trend filter. The professional insight in this lesson is that skilled scalpers judge the whole context, whether a level is fresh, whether the session is trending and whether momentum supports the move, and act only when it lines up. Our simple version shows that location is a start, not the whole answer.
Common Mistakes
- Trading patterns away from levels.
- Counter-trend wicks in strong sessions.
- Targets too close to cover costs.
- Ignoring lot size when comparing instruments.
- Reading every 1-minute candle as a signal.
Professional Insight
Many experienced price action scalpers say their skill isn't recognising patterns but recognising context: whether a level is fresh, whether the session is trending, whether momentum is behind the move. The pattern is just the moment they act, and without the right context, they don't. Keeping a screenshot of every trade, with the level and session context marked, is one of the fastest ways to build that judgement.
Risk Considerations
- Short-timeframe patterns fail frequently.
- Option premiums move with time decay and volatility as well as the index.
- Costs per point differ by instrument and lot size.
Important Terminology
| Term | Meaning |
|---|---|
| Rejection wick | A long wick showing price was pushed back from a level. |
| Inside bar | A candle within the previous candle's range. |
| Mother bar | The candle containing an inside bar. |
| Two-leg pullback | A pullback made of two dips separated by a small bounce. |
| Failed breakdown | A break below support that closes back above it. |
What is price action scalping?
Short-term trading based on candles and structure at key levels, without relying on indicators.
Which price action patterns work for scalping?
Common ones are rejection wicks, inside-bar breaks, two-leg pullbacks and failed breakouts or breakdowns, at levels.
What timeframe is best for price action scalping?
Many use 1 or 3-minute charts for entries with 5 or 15-minute charts for levels and context.
Why are Bank Nifty option costs higher per point?
Its lot size is 30, so flat brokerage per order is spread over fewer units than Nifty's 65.
Do I need indicators for scalping?
No. Many scalpers use only price, levels and perhaps VWAP.
Do candlestick patterns work better at support and resistance?
Slightly, in our test. On 10 NSE stocks, 5-minute rejection candles at the previous day's high or low or VWAP averaged +0.06R per trade before costs, against 0.00R for the same candles elsewhere.
Why do price action scalps lose money after costs?
Because 5-minute stops are small. In our NSE test, costs of 0.06% of trade value were about 0.3R per trade, larger than the edge from trading at levels. Wider targets, fewer trades or lower-cost instruments are needed to leave room.
Practical Exercise
Build a pattern log.
Your task
Step 1: Mark levels before the open
VRZs, previous day's high and low.
Step 2: Log patterns at levels
For ten sessions, on the 3-minute chart.
Step 3: Also log patterns away from levels
For comparison.
Step 4: Compare outcomes
After costs, at levels vs away from them.
Check Your Understanding
A rejection wick matters most:
Related Lessons
Previous: EMA Scalping with Supply, Demand and Momentum Candles. Next: SMC Scalping: Multi-Timeframe OB, BOS and FVG. See also Price Rejection.