
Nifty Intraday Key Levels: The Premium Open Method
JustWolves is an educational platform and is not a SEBI-registered investment advisor. Trading financial instruments involves significant risk of loss and may not be suitable for all investors. Past performance is not indicative of future results. Read our full disclaimer →
What you'll learn
- The method builds a ladder of levels on the option premium chart from the ATM call and put premiums at 9:15 am
- Read the opening premiums from the broker terminal or NSE option chain, not from a chart's first candle
- Central level = (call open + put open) ÷ 2; levels sit at fixed intervals above and below it
- Use a 25-point interval on normal Nifty days and wider intervals when the combined premium is higher
- The levels are a structured way to organise the session, not a forecast; test them before relying on them
In this article · 15 sections
Most intraday levels come from price history: yesterday's high, a swing low, a round number. The premium open method takes a different route. It uses the opening premiums of the at-the-money call and put to build a ladder of levels on the option premium chart, fresh each morning. Traders who use it like that it's objective and quick: the same two numbers produce the same levels for everyone. This lesson explains how to read the opening premiums correctly, how to build the ladder, how to choose the interval, and what the method can and can't tell you.
What You Will Learn
- How to read the opening premiums correctly
- How to build the level ladder
- How to choose the interval
- How the levels are used, and their limits
Before You Start
You need to be comfortable with option strikes, moneyness and premiums from the Futures & Options course. Also read Session-Based Scalping.
The Idea
At the open, the at-the-money (ATM) call and put premiums summarise how far the options market is pricing the index to move, and in which direction it's leaning. The method takes the average of the two opening premiums as a central reference on the premium chart, then marks levels at fixed intervals above and below it.
Through the day, the call and put premiums move through these levels as the index moves. Users of the method watch how the premiums behave at each level: whether they break and hold, or stall and reverse. The levels don't predict where price will go; they give the session a consistent structure to read.
Reading the Opening Premium Correctly
At 9:15 am
Step 1: Identify the ATM strike
The strike closest to where Nifty opens. If Nifty opens at 24,010, the ATM strike is 24,000.
Step 2: Use the current weekly expiry
Nifty weekly options expire on Tuesdays.
Step 3: Record the call's first traded price
From your broker terminal or the NSE option chain at 9:15.
Step 4: Record the put's first traded price
At the same strike and expiry.
Building the Ladder
Calculation
Step 1: Add the premiums
Call open + put open = combined premium.
Step 2: Halve it
Combined ÷ 2 = central level, rounded to a whole number.
Step 3: Choose the interval
Usually 25 points for Nifty on normal days.
Step 4: Add and subtract
Mark levels at one, two and three intervals above and below the central level.
| Level | Value | Calculation |
|---|---|---|
| +3 | 163 | 88 + 75 |
| +2 | 138 | 88 + 50 |
| +1 | 113 | 88 + 25 |
| Central | 88 | (96 + 80) ÷ 2 |
| −1 | 63 | 88 − 25 |
| −2 | 38 | 88 − 50 |
| −3 | 13 | 88 − 75 |
The same levels are applied to both the call and the put premium charts. In this example the call opened at 96, just above the central level, and the put at 80, just below it: a modest lean towards the upside at the open.
Choosing the Interval
| Combined opening premium (Nifty) | Interval |
|---|---|
| Below about 200 | 25 points |
| About 200 to 350 | 50 points |
| Above about 350 (event days) | 75 to 100 points |
Bank Nifty premiums are larger, so users of the method usually start with a 50-point interval and widen it on event days. The aim is spacing that matches the day's expected movement: too tight and every small move hits a level; too wide and the ladder says little. Combined premiums are naturally higher further from expiry, so the same thresholds won't suit every day of the week; adjust them with your own records.
Using the Levels
- 9:15 to 9:30: observe only. Note where each premium sits relative to the central level.
- Trending session: a premium breaks a level, pulls back to it, holds, and moves to the next. Trade the retest in the trend direction.
- Sideways session: premiums oscillate between two adjacent levels. Trade from one boundary towards the other.
- Stops: a few points beyond the level being traded; targets: the next level.
Trending vs Sideways Intraday Sessions covers how to classify the session and trade each type.
Real Prices: A Ladder on a Sideways Day
Our data does not include intraday option premium history, so the chart below shows the same idea on the NIFTY 50 index itself: levels every 50 points from the opening price, on a sideways session on 27 October 2026. The point is to see how price behaves around a ladder of fixed levels, not to reproduce a premium chart.
Real prices: a ladder of levels from the open on a sideways day, NIFTY 50, 27 October 2026
Step 1 of 4
The ladder
NIFTY 50 opens at 22,707.6 on 27 October 2026. Using the same idea as this lesson's premium ladder, levels go every 50 points above and below the open. In the first 15 minutes the index dips to 22,653.5, a few points beyond Level −1, and closes at 22,745.9.
- What to observe
- The first test of a ladder level.
- Condition
- Observe only until about 9:30, as this lesson advises.
Practical Example
Hypothetically, with two days to expiry, Nifty opens at 24,010. The 24,000 call's first trade is 96 and the put's is 80, giving the ladder above. By 9:45, the call premium has broken above 113 (Level +1) and pulled back to 114, holding. Neha buys one lot (65 units) at 115, with a stop at 110, below the level, and a target of 138 (Level +2).
Gross, she risks 5 points (₹325) to make 23 (₹1,495). Charges from the brokerage calculator are about ₹68 on a win and ₹64 on a loss: net, about +₹1,427 or −₹389, roughly 3.7R. Note that tight 5-point stops on option premiums are frequently hit by normal noise; that's the trade-off for the high ratio.
Do Ladder Levels Work Better Than Other Lines? Our Test
This lesson's professional insight recommends testing the method on your own records. JustWolves tested its core idea, fixed levels laddered from the open, on the NIFTY 50 index, because historical intraday option premiums are not in our data. Over 18 sessions of 1-minute prices (19 October to 13 November 2026), we marked levels every 25 or 50 points from the opening price and recorded the first time price touched each one: did it turn back 20 points before travelling 20 points through? As a control, we ran the same test on points halfway between the ladder levels.
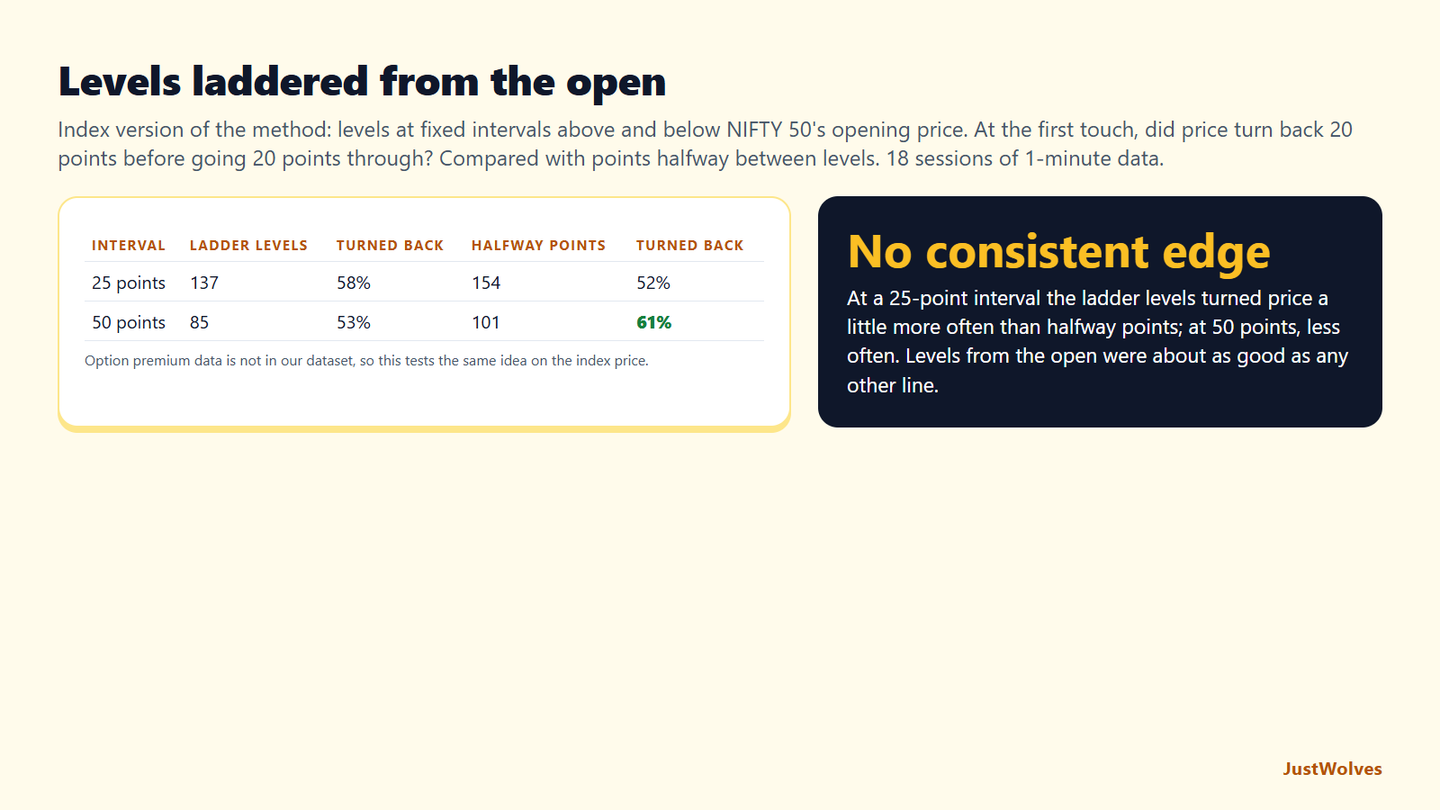
| Interval | Ladder levels touched | Turned price back | Halfway points touched | Turned price back |
|---|---|---|---|---|
| 25 points | 137 | 58% | 154 | 52% |
| 50 points | 85 | 53% | 101 | 61% |
On the index, the ladder showed no consistent edge. At a 25-point interval, ladder levels turned price back slightly more often than the halfway points; at a 50-point interval, slightly less often. With samples this size, both differences are within normal variation. Lines drawn from the open did about as well as lines drawn anywhere else.
This does not test the premium method itself. The method in this lesson builds the ladder on option premiums, which react to time decay and implied volatility as well as to the index, and uses the opening premiums as information about the market's expected move. A premium ladder could behave differently from an index ladder. What our test does show is that fixed, evenly spaced levels are not special by themselves; the value has to come from the rest of the method.
The method's real strength is the one this lesson names: consistency. The same rule produces the same levels every day, which makes it easy to keep the kind of log that can answer this question properly: how premiums behaved at each level, by session type and days to expiry, over months.
Common Mistakes
- Reading the open from the chart rather than the first trade.
- Using the wrong expiry or a strike that isn't ATM.
- Trading in the first 15 minutes.
- Treating levels as forecasts rather than reference points.
- Keeping a 25-point interval on high-volatility days.
Professional Insight
The method's main strength is consistency: it produces the same levels every day from the same rule, which makes it easy to record and test. Traders who use it seriously keep a log of how premiums behaved at each level, by session type and days to expiry, and adjust their intervals and rules from that evidence rather than from anecdotes.
Risk Considerations
- Option premiums also move with time decay and implied volatility.
- Tight stops on premiums are often hit by noise.
- No published evidence shows these levels outperform other level methods; test them.
Important Terminology
| Term | Meaning |
|---|---|
| ATM strike | The strike closest to the current index level. |
| Opening premium | The first traded price of an option at 9:15 am. |
| Central level | The average of the ATM call and put opening premiums. |
| Interval | The spacing between levels on the ladder. |
| Level ladder | The set of levels above and below the central level. |
What is the premium open method?
An intraday method that builds levels on the option premium chart from the opening premiums of the ATM call and put.
How is the central level calculated?
Add the ATM call and put opening premiums and divide by two.
What interval should I use for Nifty?
Users of the method typically start with 25 points and widen it when the combined premium is high, such as on event days.
Where do I get the opening premium?
From your broker terminal or the NSE option chain at 9:15 am, not from the first candle on a chart.
Do these levels predict the market?
No. They're a consistent framework for reading the session; test them on your own records before relying on them.
Do levels drawn from the opening price act as support and resistance?
Not more than other lines in our test. On 18 sessions of NIFTY 50 1-minute data, levels every 25 or 50 points from the open turned price back 53% to 58% of the time, against 52% to 61% for points halfway between them.
Can I backtest the premium open method?
Yes, if you record the at-the-money call and put premiums at the first trade each morning and the premium path through the day. Historical intraday option data is harder to obtain than index data, so many users of the method keep their own daily log.
Practical Exercise
Build and log the ladder.
Your task
Step 1: Record the opens
ATM call and put first trades at 9:15 for 20 sessions.
Step 2: Build each day's ladder
With the interval guide.
Step 3: Log premium behaviour
Break-and-hold or reversal at each level touched.
Step 4: Compare
Behaviour by days to expiry and by session type.
Check Your Understanding
Call opens at 96, put at 80. Central level:
Related Lessons
Previous: Session-Based Scalping. Next: Trending vs Sideways Intraday Sessions. See also the Futures & Options course.