
Ratio Spreads: Uneven Options Positions
JustWolves is an educational platform and is not a SEBI-registered investment advisor. Trading financial instruments involves significant risk of loss and may not be suitable for all investors. Past performance is not indicative of future results. Read our full disclaimer →
What you'll learn
- A ratio spread buys one option and sells a larger number of further OTM options of the same type
- It can often be opened for a credit and profits most if the underlying finishes at the short strike
- The extra short options leave the position naked: unlimited risk for call ratios, very large for put ratios
- Losses beyond the upper breakeven grow at the rate of the uncovered options
- Ratio spreads are a professional-level strategy that needs active management and large capital
In this article · 16 sections
A ratio spread buys one option and sells two (or more) further out. The extra short options pay for the bought one, often leaving a net credit, and the position profits most if the market moves moderately toward the short strike. Beyond that, the uncovered short options turn the position into a naked short with unlimited or very large risk. This professional-level lesson explains how ratio spreads work and why they need careful handling.
What You Will Learn
- How call and put ratio spreads are built
- Their profit zone and breakeven
- Why the uncovered leg creates large risk
- How professionals manage them
Before You Start
Read Calendar Spreads and Short Calls and Short Puts first. This lesson assumes comfort with the Greeks and with naked option risk.
How It's Built
| Leg | Action | Premium |
|---|---|---|
| 24,000 call | Buy 1 | −418 |
| 24,300 call | Sell 2 | +550 (2 × 275) |
| Net | +132 credit |
The Payoff
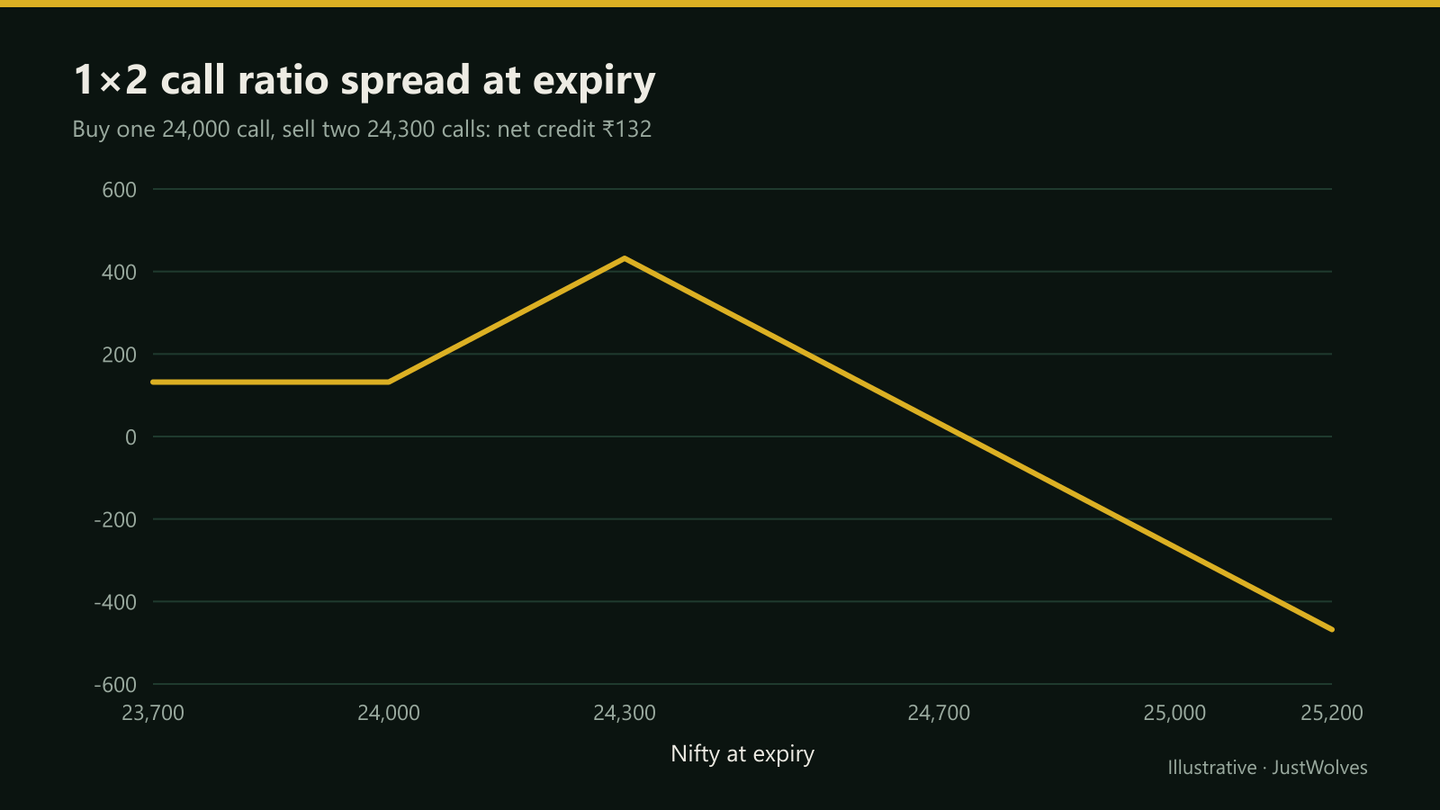
- Below 24,000: all calls expire worthless; you keep the ₹132 credit.
- Between 24,000 and 24,300: the bought call gains; profit rises to a maximum of 300 + 132 = ₹432 at 24,300.
- Above 24,300: one short call is covered by the bought call; the second is naked, so profit falls one-for-one.
- Upper breakeven: 24,300 + 432 = 24,732. Above that, losses grow without limit.
The Greeks
At entry, a 1×2 call ratio is usually close to delta-neutral or slightly short delta, with negative gamma and negative vega from the extra short option. As the market rallies toward and past the short strike, delta turns increasingly negative, and the position starts behaving like a growing short.
Rising implied volatility hurts the position, because it's short more options than it owns. A rally accompanied by a volatility spike is the worst case.
Put Ratio Spreads
The mirror version buys one put and sells two lower puts. It profits from a modest fall toward the short strike, keeps any credit if the market rises, and carries very large risk in a crash. Because sharp falls are more common than sharp rallies, and implied volatility jumps in sell-offs, put ratio spreads are generally considered the more dangerous of the two.
Managing Ratio Spreads
- Hard stop at a level before the breakeven, not at it.
- Buy a further OTM option to cap the naked leg, turning it into a defined-risk structure (sometimes called a broken-wing butterfly).
- Delta hedge with futures as the market moves toward the short strike, if you have the capital and systems to do so.
- Avoid events that could produce gaps beyond the breakeven.
Real Prices: A Ratio Spread That Reached Its Target
Vijay's example describes the ideal path: a slow drift to the short strike. The chart below shows a 1×2 call ratio doing exactly that on real NIFTY 50 prices from October and November 2025, valued each day by a standard pricing model. The test below shows how rare and how fragile that outcome is.
Real NIFTY prices: a 1×2 call ratio that drifted to its target, October–November 2025
Step 1 of 4
Opening for a credit
On 20 October 2025 NIFTY closes at 25,843. A trader buys one 25,850 call and sells two 26,150 calls expiring on 20 November, for a modelled credit of about 74 points: ₹4,800 per lot. Maximum profit about 374 at 26,150; upper breakeven about 26,524; unlimited loss above that.
- What to observe
- Like Vijay in this lesson: a view of a slow drift up, not a breakout.
- Condition
- Stop planned well before 26,524.
Why Traders Use Them
Ratio spreads appeal to traders who expect a moderate move toward a target but not beyond it. Opened for a credit, they pay something even if the market doesn't move at all, and they pay most if it reaches the short strike. That combination is hard to achieve with simpler spreads.
The cost is the uncovered option. It's what makes the credit possible, and it's what creates the open-ended loss. Professionals accept that risk only with active hedging and strict limits; for others, the protected broken-wing version is usually the better choice.
Practical Example
Hypothetically, Nifty is at 24,000 and Vijay expects a slow drift toward 24,300 but not beyond. He opens a 1×2 call ratio for a ₹132 credit (₹8,580 per lot of the bought call), with a hard stop if Nifty closes above 24,550, well before the 24,732 breakeven.
Two weeks later, Nifty is at 24,280. He closes for a profit. In another scenario, a policy surprise gaps Nifty to 24,900 at the open; his stop is skipped and the position shows a loss of roughly (24,900 − 24,732) × 65 ≈ ₹10,920 at expiry values, larger after volatility rises.
Ratio Spreads on Two Years of NIFTY: Our Test
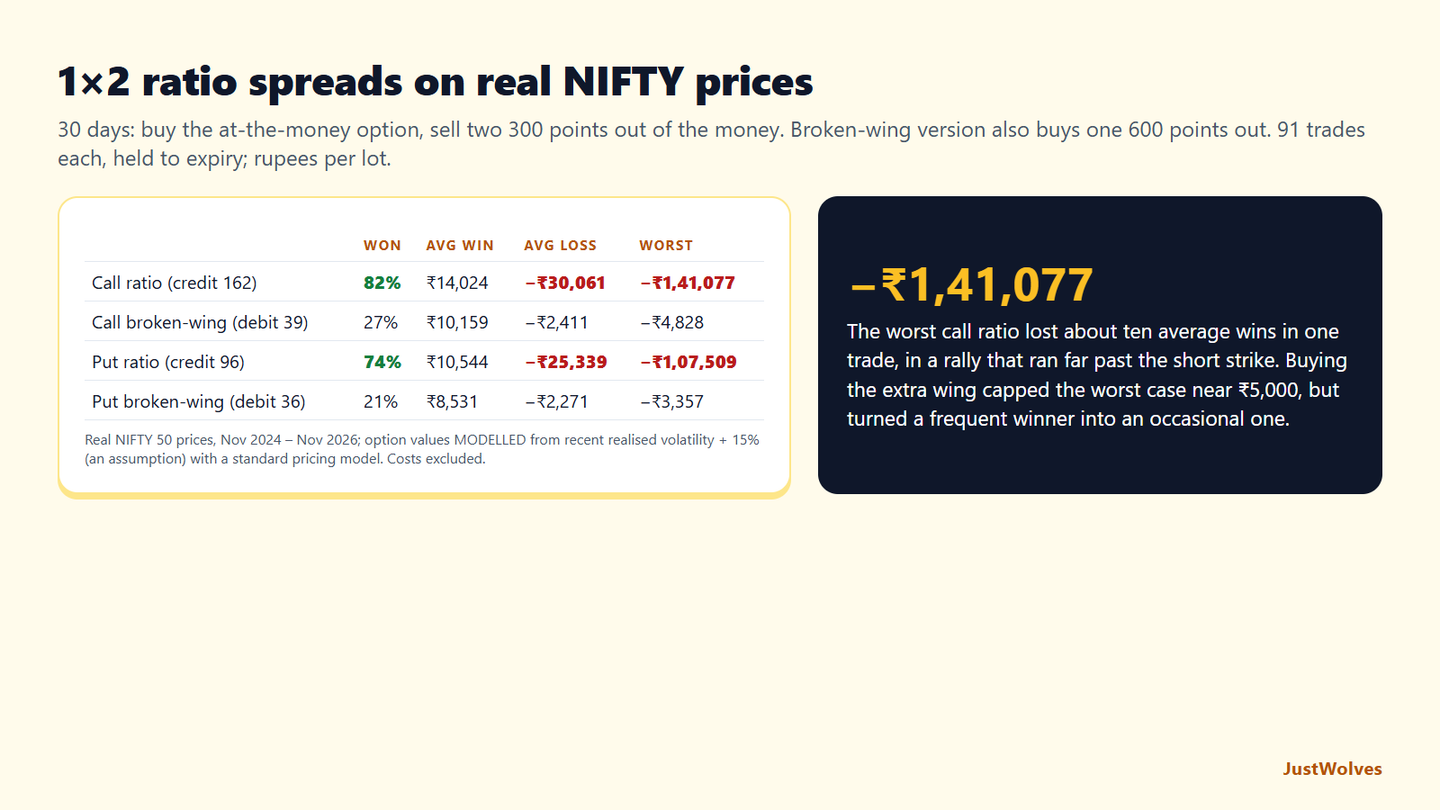
JustWolves opened 1×2 ratio spreads on NIFTY every week for about two years (November 2024 to November 2026): buy the at-the-money option, sell two options 300 points further out, about 30 days to expiry, held to expiry, 91 trades for calls and 91 for puts. We also tested the protected broken-wing version that buys one more option 600 points out, which this lesson recommends for most traders. Values were modelled from recent realised volatility plus 15%.
| Won | Average win | Average loss | Worst | Average per trade | |
|---|---|---|---|---|---|
| Call ratio (avg credit 162 points) | 82% | ₹14,024 | −₹30,061 | −₹1,41,077 | +₹6,273 |
| Call broken-wing (avg debit 39) | 27% | ₹10,159 | −₹2,411 | −₹4,828 | +₹1,042 |
| Put ratio (avg credit 96) | 74% | ₹10,544 | −₹25,339 | −₹1,07,509 | +₹1,081 |
| Put broken-wing (avg debit 36) | 21% | ₹8,531 | −₹2,271 | −₹3,357 | −₹15 |
The naked leg did exactly what this lesson warns. The call ratio won 82% of trades and averaged a healthy profit, but its worst trade lost about ₹1,41,000 per lot, roughly ten average wins, in the October–November 2026 rally that ran far past the short strike. The put ratio's worst, about ₹1,07,500, came in the February–March 2026 fall. Both are the "rally with a volatility spike" and crash scenarios this lesson's Greeks and put-ratio sections describe.
The broken-wing versions removed the disaster and most of the wins. Buying the extra option capped the worst loss at under ₹5,000, but at these strike distances it also turned the trades into small debits, so they made money only when NIFTY finished near the middle: 21–27% of the time. That is a different trade, closer to a butterfly, and it should be judged as one.
One assumption in this lesson did not hold in this period. The put-ratio section says sharp falls are more common than sharp rallies; in our two years the call ratio's worst loss was the larger one, after a strong rally. Size either version as if its own disaster scenario will eventually arrive.
Common Mistakes
- Treating a credit entry as low risk.
- Stops at the breakeven instead of before it.
- Ignoring the naked leg's margin and gap risk.
- Holding put ratios into market stress.
- Large ratios (1×3, 1×4) without hedges.
Professional Insight
Professionals who trade ratio spreads usually manage the naked exposure actively, with delta hedges or by buying back the extra short option as the market approaches it. For most individual traders, the broken-wing butterfly, which adds a further protective option, captures much of the payoff without the open-ended tail.
Risk Considerations
- Unlimited or very large losses beyond the breakeven.
- Gaps skip stops.
- Volatility spikes worsen losses.
Important Terminology
| Term | Meaning |
|---|---|
| Ratio spread | Buying one option and selling more of a further OTM option. |
| 1×2 | One bought, two sold. |
| Naked leg | The short option not covered by a bought option. |
| Broken-wing butterfly | A ratio spread with an added protective option. |
| Delta hedge | Offsetting directional exposure, often with futures. |
What is a ratio spread?
A strategy that buys one option and sells more options of the same type further out of the money.
What is the risk of a call ratio spread?
Unlimited above the upper breakeven, because one short call is uncovered.
Can a ratio spread be opened for a credit?
Often, yes, but a credit entry doesn't reduce the tail risk.
What is a broken-wing butterfly?
A ratio spread with a further OTM option bought to cap the naked leg's loss.
Who should trade ratio spreads?
Experienced traders with large capital and active risk management.
How often does a ratio spread make money?
Often, until it doesn't. In our test of 30-day NIFTY 1×2 ratio spreads on two years of real prices with modelled premiums, call ratios made money 82% of the time and put ratios 74%, but their worst trades lost about ₹1,41,000 and ₹1,07,500 per lot.
Is a broken-wing butterfly safer than a ratio spread?
Yes, in the sense that its loss is capped. In our NIFTY test, the broken-wing versions never lost more than about ₹5,000 per lot. But at the same strike distances they cost a small debit and made money only 21–27% of the time, so they are a different, lower-probability trade.
Practical Exercise
Compare ratio and broken-wing versions.
Your task
Step 1: Build a 1×2 call ratio
On Nifty, in your broker's strategy builder.
Step 2: Note
Credit, peak profit and upper breakeven.
Step 3: Add protection
Buy one call 300 points above the short strike.
Step 4: Compare
Maximum loss and margin for both versions.
Check Your Understanding
A 1×2 call ratio spread:
Related Lessons
Previous: Calendar Spreads. Next module: Position Greeks for Option Sellers.