
Backtesting Option-Selling Strategies
JustWolves is an educational platform and is not a SEBI-registered investment advisor. Trading financial instruments involves significant risk of loss and may not be suitable for all investors. Past performance is not indicative of future results. Read our full disclaimer →
What you'll learn
- Option-selling backtests need historical option prices, not just underlying prices
- Include realistic fills, bid-ask spreads, brokerage, STT and slippage
- The test period must include crashes and volatility spikes, or results will be misleadingly smooth
- Judge results by worst loss and drawdown as much as by average return
- Rules changes (lot sizes, expiries, margins) mean old data doesn't always reflect current conditions
In this article · 16 sections
Option-selling strategies are easy to make look good on paper. Pick a calm period, ignore costs, assume fills at mid-prices, and a short strangle can appear to print money. Real results are shaped by exactly what such tests leave out: crashes, volatility spikes, wide spreads and transaction costs. This professional-level lesson explains how to backtest option-selling strategies honestly, and how to read the results.
What You Will Learn
- What data an option backtest needs
- How to model fills and costs realistically
- Why test periods must include tail events
- How to read results and avoid overfitting
Before You Start
Read Position Sizing, Maximum Loss and Stress Testing, and from the Risk course, How to Backtest.
The Data You Need
- Historical option prices: for every strike and expiry you trade, at the times you'd enter and exit. Underlying prices alone aren't enough, because option prices depend on implied volatility.
- Bid and ask, not just last price: fills happen at the bid when selling and the ask when buying.
- Contract specifications by date: lot sizes, expiry days and weekly expiry availability have all changed over time in India.
Some data vendors and broker platforms provide historical option chains. Without them, an option-selling backtest relies on model prices, which smooth out exactly the volatility spikes that matter most.
Fills and Costs
| Cost | Why it matters |
|---|---|
| Bid-ask spread | Selling at the bid and buying back at the ask on every leg |
| Brokerage | Per order or per lot, on every leg |
| STT | 0.15% of premium on options sold from April 2026, plus exercise STT if held to expiry ITM |
| Exchange and regulatory charges, stamp duty, GST | Small per trade but add up |
| Slippage on stops | Stops fill worse than their level, especially in fast markets |
Tail Events and Test Periods
Option-selling results are dominated by rare, large losses. A backtest that doesn't include market crashes, volatility spikes and large gaps is testing only the calm part of the distribution.
Use the longest period your data allows, check that it contains several stress episodes, and report the worst single loss and the largest drawdown alongside average results.
Real Prices: The Month That Decided a Backtest
This lesson says option-selling results are dominated by rare, large losses. The chart below shows one: month 15 of the JustWolves backtest described below, a 0.20-delta NIFTY strangle through the February–March 2026 fall, valued each day by a standard pricing model.
Real NIFTY prices: the month that decided a backtest, February–March 2026
Step 1 of 4
Month 15 of 22
In our 22-month backtest of a monthly 0.20-delta NIFTY strangle, this month starts on 20 February 2026 with NIFTY at 25,571: sell the 26,750 call and 24,750 put for a modelled 272 points, ₹17,690 per lot. By 26 February it is up about ₹4,000.
- What to observe
- Fourteen months in, the backtest is comfortably profitable.
- Condition
- A short test window ending here would look excellent.
Reading the Results
- Expectancy after costs: the average result per trade.
- Worst loss: in rupees and as a share of capital.
- Maximum drawdown: the largest peak-to-trough decline.
- Recovery time: how long it took to regain the previous peak.
- Dependence on a few months: how results change if the best or worst months are removed.
Avoiding Overfitting
It's tempting to tune strike distance, profit targets and stop levels until the backtest looks perfect. Rules tuned that closely to past data often fail on new data.
Keep rules simple, test them on a period you didn't use to design them (an out-of-sample test), and check that small changes in parameters don't change results dramatically. A robust strategy works across a range of reasonable settings, not just one.
Forward Testing
After a backtest, run the strategy on paper or in very small size for several months. Forward testing reveals execution problems, real fills and your own ability to follow the rules, none of which a backtest can show. The Paper Trading lesson covers this step.
Practical Example
Hypothetically, Siddharth backtests a monthly Nifty iron condor using three years of historical option chains. Before costs, it shows a positive expectancy. After modelling bid-ask spreads, brokerage, STT and stop slippage, the average win shrinks by a noticeable share and the expectancy is smaller but still positive.
He then checks that the test period includes at least two sharp sell-offs, records the worst month and the maximum drawdown, and re-runs with strike distances 50 points either side of his chosen setting. Results stay similar, so he moves to three months of small-size forward testing before trading normally.
How Fragile Is a Backtest? Our Own Study, Examined
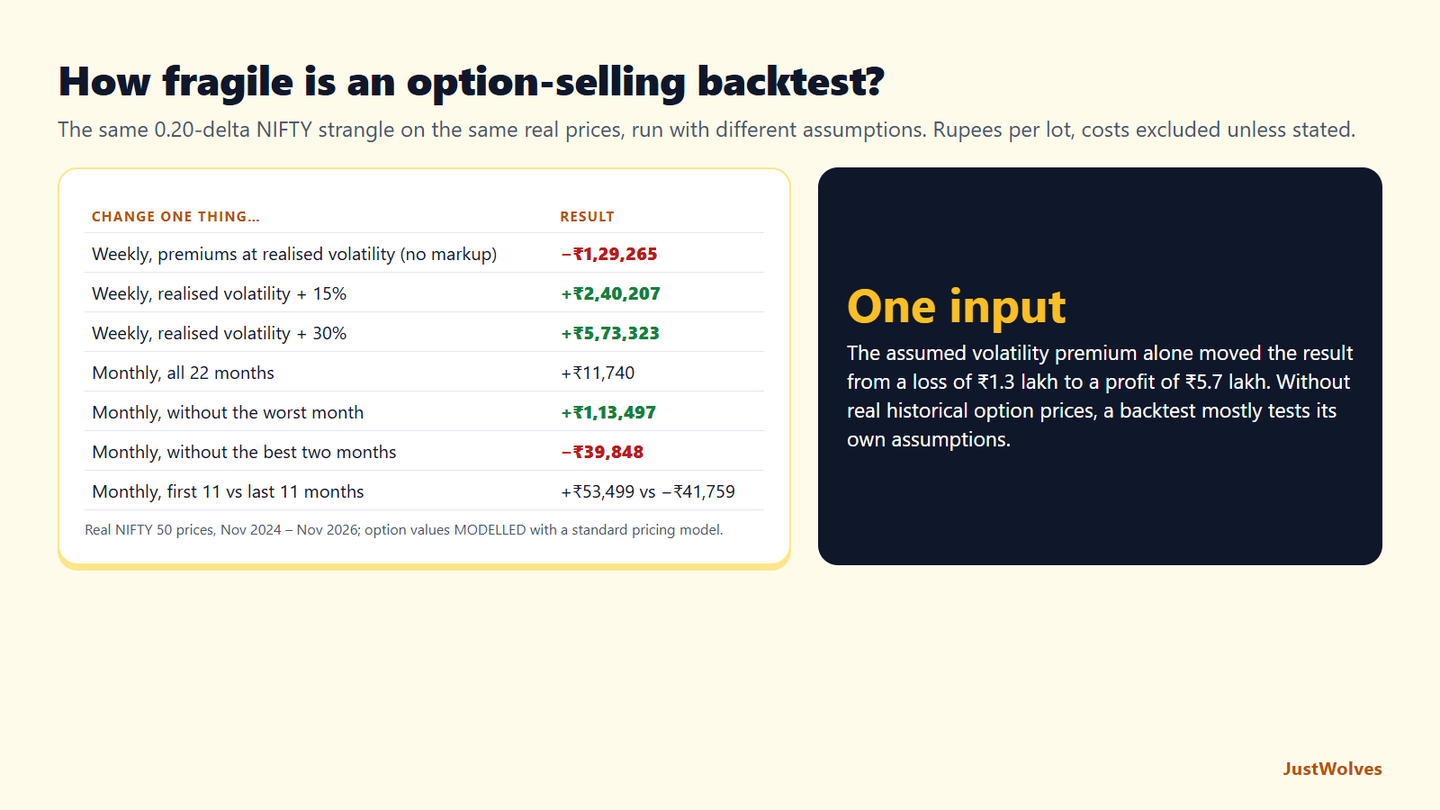
Every option-selling lesson on JustWolves includes a test on real NIFTY prices. This lesson turns the same scrutiny on those tests. We do not have historical option chains, so our option prices are modelled from recent realised volatility plus a 15% markup that stands in for the premium option buyers usually pay. That is exactly the limitation this lesson's data section warns about. Here is how much it matters, using a 0.20-delta NIFTY strangle on about two years of real prices (November 2024 to November 2026).
| Change one thing… | Result |
|---|---|
| Weekly entries, premiums at realised volatility (no markup) | −₹1,29,265 |
| Weekly entries, realised volatility + 15% (our standard) | +₹2,40,207 |
| Weekly entries, realised volatility + 30% | +₹5,73,323 |
| Monthly entries, all 22 months | +₹11,740 |
| Monthly, without the single worst month | +₹1,13,497 |
| Monthly, without the two best months | −₹39,848 |
| Monthly, first 11 months vs last 11 months | +₹53,499 vs −₹41,759 |
| Check | Result |
|---|---|
| Costs per monthly trade (assumed: 1 point slippage per leg, ₹20 per order, STT) | Strangle about ₹190, condor about ₹350 |
| Monthly strangle average, before vs after those costs | ₹534 vs ₹342 |
| Strangle delta 0.10 → 0.30 (weekly) | Average ₹1,109 → ₹5,266; worst −₹88,026 → −₹1,21,025 |
| Condor wing 100 → 500 points (weekly) | Average ₹498 → ₹1,544; worst −₹4,358 → −₹26,872 |
The volatility assumption decided the answer. With premiums priced at realised volatility, the strangle lost about ₹1.3 lakh; with a 15% markup it made ₹2.4 lakh; with 30%, ₹5.7 lakh. Real implied volatility in India has often been above realised volatility, but by how much varies from month to month, and that is precisely what a model cannot know. Our option-selling results are therefore best read as comparisons, which structure lost less, which exit worked better, rather than as forecasts of profit. This is why this lesson insists on historical option prices for any backtest you intend to trade.
One month decided the monthly backtest. Removing the February–March 2026 month, shown in the chart above, raised the result almost tenfold; removing the two best months turned it into a loss. The first and second halves pointed in opposite directions. This lesson's checklist, worst loss, drawdown, dependence on a few months, is not optional detail: here it was the whole story.
Costs and parameters behaved as this lesson predicts. Costs took about a third of the monthly strangle's thin average profit. Moving strikes closer or wings wider raised average profit and worst loss together, a reminder that "better" settings in a backtest are often just more risk.
Common Mistakes
- Using last-traded prices instead of bid and ask.
- Ignoring costs and slippage.
- Testing only calm periods.
- Optimising until perfect on one data set.
- Ignoring rule changes such as lot sizes and expiry days.
Professional Insight
Professional researchers often spend more effort on data quality and cost modelling than on strategy ideas. For option selling in particular, they judge strategies by how they behave in the worst periods, because that's what determines whether the strategy can be traded at all.
Risk Considerations
- Past tails don't cap future tails.
- Data gaps can hide the worst moments.
- Overfitted rules fail live.
Important Terminology
| Term | Meaning |
|---|---|
| Backtest | Testing rules on historical data. |
| Out-of-sample test | Testing on data not used to design the rules. |
| Overfitting | Tuning rules too closely to past data. |
| Maximum drawdown | The largest peak-to-trough decline. |
| Forward test | Running the strategy live on paper or in small size. |
How do I backtest an option-selling strategy?
Use historical option chains with bid and ask prices, model all costs and slippage, and test over periods that include market stress.
Can I backtest with underlying prices only?
Only roughly, using model prices, which tend to understate losses in volatility spikes.
Why do option-selling backtests look too good?
Often because they ignore costs, use mid-prices or cover only calm periods.
What should I look at besides profit?
Worst loss, maximum drawdown, recovery time and how results depend on a few months.
What comes after a backtest?
Forward testing on paper or in small size to check execution and discipline.
Can I trust an option backtest built on a pricing model?
Only for comparisons. In our NIFTY study, changing the assumed volatility premium from 0% to 15% to 30% moved the same strangle backtest from a loss of about ₹1.3 lakh to profits of ₹2.4 lakh and ₹5.7 lakh. Use historical option prices for anything you plan to trade.
How much can one month change a backtest?
Completely. In our 22-month NIFTY strangle backtest, the total was about ₹11,700 per lot; without the single worst month it was about ₹1,13,500, and without the two best months it was a loss. Always report the worst month and the largest drawdown.
Practical Exercise
Design a backtest.
Your task
Step 1: Write the rules
Entry, strikes, exits, adjustments and size for one strategy.
Step 2: Find data
A source of historical Nifty option chains.
Step 3: List costs
Every cost and how you'll model it.
Step 4: Choose periods
Including at least two stress episodes, plus an out-of-sample period.
Check Your Understanding
An option-selling backtest needs:
Related Lessons
Previous: Position Sizing, Maximum Loss and Stress Testing. This completes the Option Selling course. See also How to Backtest.