
Option Buying vs Option Selling
JustWolves is an educational platform and is not a SEBI-registered investment advisor. Trading financial instruments involves significant risk of loss and may not be suitable for all investors. Past performance is not indicative of future results. Read our full disclaimer →
What you'll learn
- Buyers have small, frequent losses and occasional large gains; sellers have the reverse
- Win rate alone says nothing: expectancy depends on average win and average loss too
- Buyers pay premium and time decay; sellers post margin and carry tail risk
- Buyers are long gamma and vega; sellers are short gamma and vega
- Neither side has a guaranteed edge; results depend on pricing, sizing and discipline
In this article · 16 sections
A popular claim in Indian trading circles is that 'option sellers make money and buyers lose'. Like most simple claims, it's half true. Sellers do win more often, but win rate is only part of the picture. This lesson compares buying and selling directly, looking at payoffs, the shape of returns, capital, the Greeks, and what actually determines whether either side profits.
What You Will Learn
- How buyer and seller payoffs mirror each other
- Why win rate is misleading on its own
- Differences in capital, margin and Greeks
- What decides profitability for each side
Before You Start
Read What Is Option Selling? and, from the Risk course, Win Rate, Expectancy and Profit Factor.
Mirror-Image Payoffs
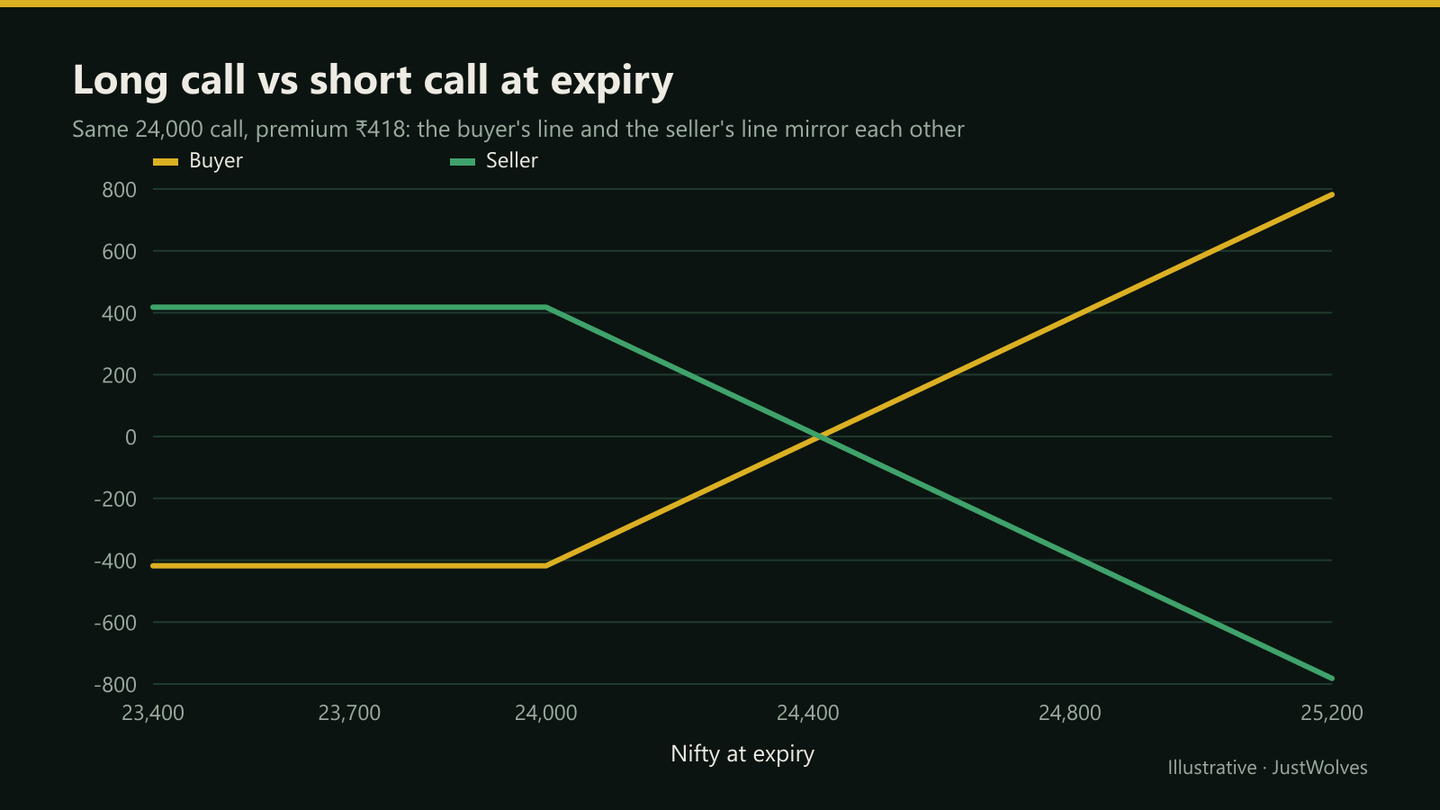
Before costs, an option buyer's profit is exactly the seller's loss, and vice versa. Options trading is zero-sum between the two sides of each contract; after brokerage and taxes, it's negative-sum for traders as a group.
Win Rate vs Expectancy
Sellers win more often because many options expire worthless. But each win is capped at the premium, while each loss can be large. Buyers lose more often, but their wins can be many times their losses.
What matters is expectancy: (win rate × average win) − (loss rate × average loss). A seller winning 80% of trades with an average win of ₹4,000 and an average loss of ₹20,000 has an expectancy of (0.8 × 4,000) − (0.2 × 20,000) = −₹800 per trade, despite winning four times out of five.
Side-by-Side Comparison
| Buyer | Seller | |
|---|---|---|
| Upfront | Pays premium | Receives premium, posts margin |
| Maximum loss | Premium | Large or unlimited |
| Maximum profit | Large or unlimited | Premium |
| Typical result pattern | Many small losses, few large gains | Many small gains, few large losses |
| Gamma / vega | Long (benefits from big moves and rising IV) | Short (hurt by big moves and rising IV) |
| Theta | Pays it daily | Collects it daily |
What Decides the Winner
- Pricing: whether the premium was high or low relative to the move that actually happened.
- Sizing: sellers who size too big don't survive the rare large loss; buyers who size too big don't survive long losing streaks.
- Discipline: exits, stops and adjustments applied consistently.
- Costs: brokerage and STT, which hit frequent traders on both sides.
The Psychology of Each Side
Buying options means living with frequent small losses while waiting for an occasional large gain. Many traders find the losing streaks hard to tolerate and abandon a sound approach too early.
Selling options feels comfortable most of the time, because small wins arrive regularly. The danger is complacency: after many winning months, sellers often increase size, so the eventual large loss arrives on their biggest position. Knowing which pattern you can handle emotionally is as important as knowing the maths.
Combining Both
Spreads combine buying and selling in one position. A credit spread sells an option and buys a cheaper one further out, keeping most of the seller's characteristics while capping the loss. A debit spread does the reverse. Much of the rest of this course uses these combinations to keep the seller's advantages while limiting the tail risk.
Practical Example
Hypothetically, over ten months, Ajay sells one Nifty strangle each month for about ₹15,000 of premium. Eight months, both options expire worthless: +₹1,20,000. In month nine, a 6% fall costs him ₹95,000; in month ten, a sharp rally costs ₹40,000. His net result is −₹15,000 before costs, despite winning 80% of months.
Meera, over the same period, buys options before breakouts. She loses small amounts in seven months and makes large gains in three. Her result depends just as much on the size of her winners as on how often she wins.
Real Prices: One Month, Both Sides
Ajay's and Meera's stories are hypothetical. The chart below follows a monthly NIFTY strangle like Ajay's through a real month in July and August 2025, showing both sides of the same trade. Option values are modelled each day; the index moves are real.
Real NIFTY prices: a month that went to the seller, July–August 2025
Step 1 of 4
The same trade, two sides
On 18 July 2025 NIFTY closes at 24,968. The 25,250 call and 24,650 put expiring on 19 August are modelled at about 291 points together: ₹18,900 per lot. Ajay, from this lesson, sells this strangle; a buyer on the other side pays the same ₹18,900.
- What to observe
- The seller needs NIFTY to stay between the strikes; the buyer needs it to leave.
- Condition
- One side's gain is exactly the other's loss.
Seller vs Buyer Over 22 Real Months: Our Test
JustWolves ran Ajay's strategy on about two years of real NIFTY 50 prices. Each month, from December 2024 to October 2026, we sold a strangle: the call 300 points above and the put 300 points below the nearest strike, with about 30 days to expiry, held to expiry. That makes 22 consecutive, non-overlapping months. Premiums were modelled from recent realised volatility plus 15%, and the buyer's result is the exact mirror of the seller's.
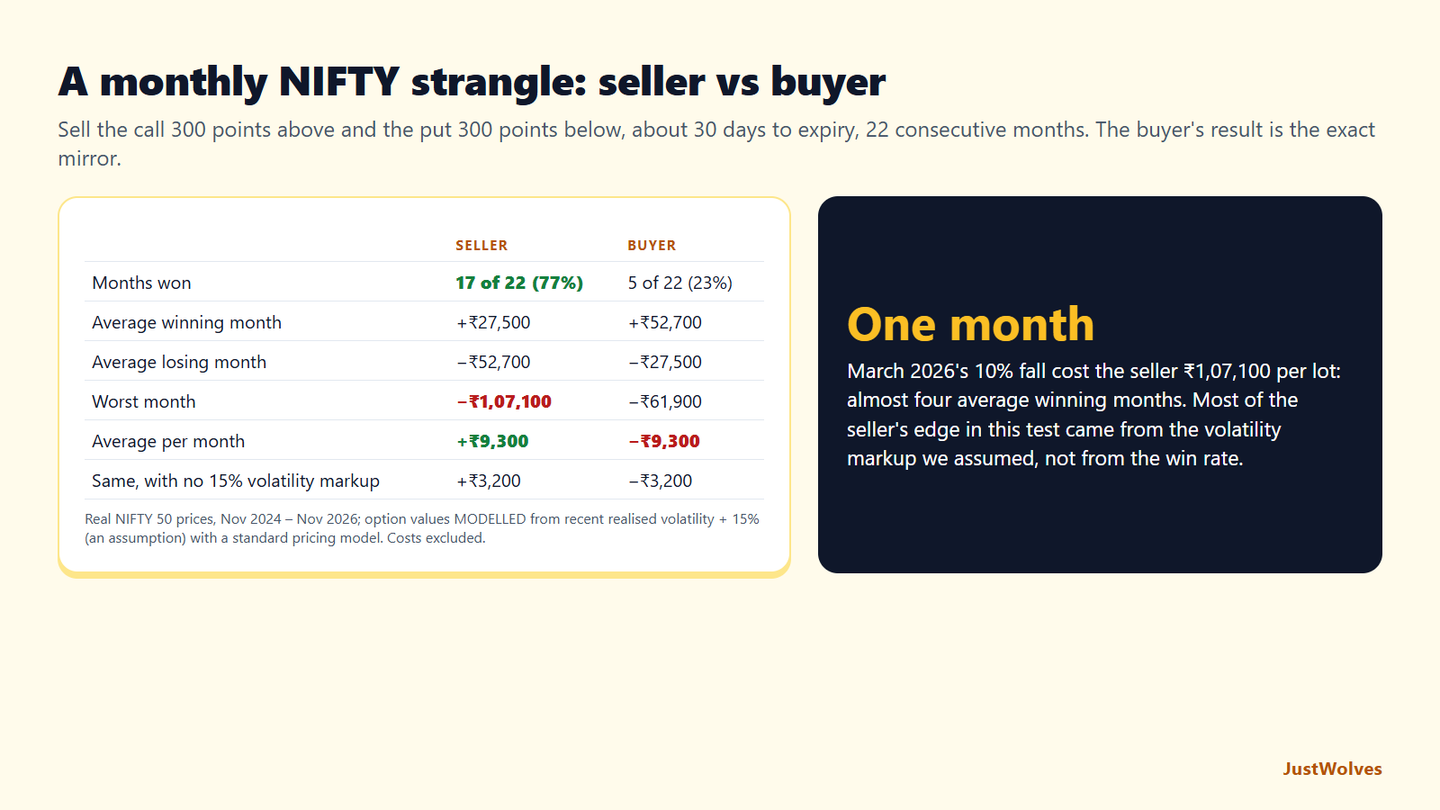
| Seller | Buyer | |
|---|---|---|
| Months won | 17 of 22 (77%) | 5 of 22 (23%) |
| Average winning month | +₹27,500 | +₹52,700 |
| Average losing month | −₹52,700 | −₹27,500 |
| Worst month | −₹1,07,100 (Feb–Mar 2026) | −₹61,900 |
| Average per month (expectancy) | +₹9,300 | −₹9,300 |
| Average per month with no 15% volatility markup | +₹3,200 | −₹3,200 |
This is the expectancy formula in this lesson, on real prices. The seller won 77% of months but lost almost twice as much in a losing month as it made in a winning one. Five bad months, led by the 10% fall in March 2026 that cost ₹1,07,100, took back more than half of the 17 good months' gains.
The most important row is the last one. With premiums priced at 15% above recent realised volatility, the seller earned about ₹9,300 a month. Priced at realised volatility with no markup, that fell to about ₹3,200, before costs that would take most of what was left. Most of the seller's edge in this test came from the volatility premium we assumed, not from the win rate. In real markets that premium varies: when implied volatility is rich, sellers are paid well for the risk; when it is cheap, the same win rate can come with a negative expectancy.
That supports this lesson's conclusion that neither side has a built-in edge. What decides the result is pricing, whether premiums are high or low compared with the moves that follow, and then sizing and costs.
Common Mistakes
- Choosing a side based on win rate.
- Assuming sellers always win.
- Ignoring average loss size.
- Selling without capital to absorb a tail event.
- Buying without accepting frequent small losses.
Professional Insight
Many professional options traders are neither 'buyers' nor 'sellers' by identity. They buy or sell depending on whether implied volatility looks cheap or expensive, and they often hold both bought and sold options at once, managing the combined Greeks. Their question is never 'buy or sell?' in general, but whether this particular option, at this price, is worth owning or worth selling.
Risk Considerations
- Sellers: tail losses, margin calls, gaps.
- Buyers: losing streaks, time decay, IV crush.
- Both: costs and overtrading.
Important Terminology
| Term | Meaning |
|---|---|
| Zero-sum | One side's gain equals the other's loss, before costs. |
| Expectancy | Average result per trade. |
| Tail risk | The risk of rare, extreme moves. |
| Long gamma | Benefiting from large moves. |
| Short vega | Hurt by rising implied volatility. |
Is option selling better than option buying?
Neither is better overall. Sellers win more often but face large occasional losses; buyers win less often but with larger gains.
Why do people say option sellers make money?
Because many options expire worthless. That ignores the size of sellers' occasional losses.
How much capital do I need to sell options?
Enough to post margin with a large buffer and absorb a severe loss. Small accounts are poorly suited to naked selling.
Is options trading zero-sum?
Between buyer and seller of the same contract, yes before costs; after costs, it's negative-sum for traders overall.
Can I do both?
Yes. Many strategies combine bought and sold options, such as spreads.
Do option sellers really win most of the time?
Usually, yes. In our test of a monthly NIFTY strangle over 22 real months, the seller won 77% of months. But the average losing month cost about ₹52,700 per lot against ₹27,500 for a winning month, so the win rate alone did not decide the result.
Where does an option seller's edge come from?
From the price of the options. When implied volatility is higher than the movement that follows, sellers are paid more than the risk costs them. In our test, removing a 15% volatility markup cut a NIFTY strangle seller's average result from about ₹9,300 a month to ₹3,200, before costs.
Practical Exercise
Calculate expectancy.
Your task
Step 1: Assume a seller's record
Win rate 85%, average win ₹3,000.
Step 2: Find breakeven loss
What average loss makes expectancy zero?
Step 3: Compare
With the loss from a 5% Nifty move on a short strangle per lot.
Step 4: Reflect
Is the win rate enough?
Check Your Understanding
Before costs, the option buyer's profit equals:
Related Lessons
Previous: What Is Option Selling?. Next: Time Decay (Theta) for Option Sellers. See also Option Buying: Strategies and Risks.