
Power of Three (AMD): Accumulation, Manipulation, Distribution
JustWolves is an educational platform and is not a SEBI-registered investment advisor. Trading financial instruments involves significant risk of loss and may not be suitable for all investors. Past performance is not indicative of future results. Read our full disclaimer →
What you'll learn
- Power of Three (PO3) describes a candle's life as accumulation, manipulation and distribution (AMD)
- On a bullish daily candle: a quiet range near the open, a move below the open, then the real move up
- Intraday, it often maps to Asia (accumulation), London (manipulation) and New York (distribution)
- The trade idea is to enter after the manipulation, in the direction of the daily bias
- It's a description of a common candle shape, not a forecast for every day
In this article · 14 sections
Look at a typical bullish daily candle and you'll see a shape: it opens, dips below the open, then rallies to close near the high. ICT calls this the Power of Three: accumulation, manipulation and distribution. The idea is that if you know the day's likely direction, the dip against it is an opportunity rather than a threat. This lesson explains the model, how it maps to the sessions, and how traders use it.
What You Will Learn
- The three phases of the Power of Three
- How PO3 maps onto a daily candle and the trading sessions
- How to plan a trade around the manipulation phase
- The model's limits
Before You Start
Read The Asian Range and London and New York Sessions first.
The Three Phases
- Accumulation: a quiet range, often near the open, where price builds positions in both directions. In ICT's story, larger participants build positions; observably, it's a tight range.
- Manipulation: a move against the day's eventual direction, typically through the accumulation range and the opening price, taking resting liquidity. On a bullish day it's the move down.
- Distribution: the real move in the day's direction, away from the manipulation, often lasting into the close.
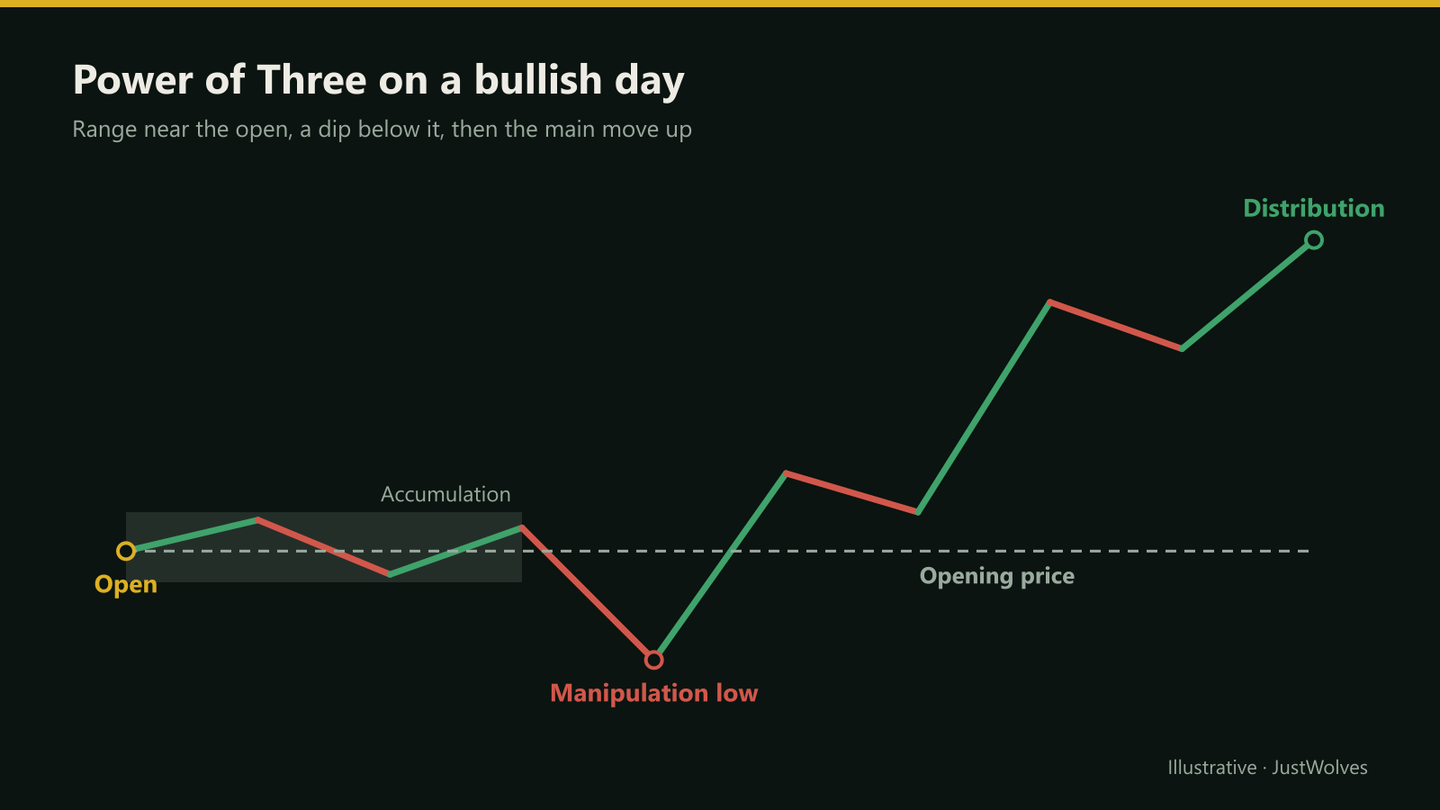
Step Through an AMD Day
The chart below shows a bullish day built around the midnight New York open. Step through it, and notice that the "manipulation" only looks like manipulation once the day has finished.
A bullish Power of Three day, hour by hour
Step 1 of 4
Accumulation around the open
The day opens at midnight New York (10:30 am IST in winter) at 1.2722. Price trades in a small range around the open.
- What to observe
- A quiet range near the opening price.
- Condition
- Mark the midnight open. Your bias (bullish here) was set beforehand.
Mapping PO3 to Candles and Sessions
| Phase | Daily candle | Typical session |
|---|---|---|
| Accumulation | Range around the open | Asian session |
| Manipulation | The lower wick: a move below the open | Early London |
| Distribution | The body up to the close | Late London and New York |
ICT often references the New York midnight opening price as the open for this purpose, which is about 10:30 am IST in winter and 9:30 am IST in summer. The model is fractal: the same shape is described on weekly, 4-hour and even 1-hour candles. On a weekly candle, for example, the manipulation is often described as forming early in the week, with distribution through the middle and end of the week.
Trading the Manipulation
Bullish day example
Step 1: Daily bias
Decide the likely direction from higher-timeframe structure and the draw on liquidity (lesson 03.02.05).
Step 2: Mark the open
The New York midnight opening price, and the Asian range.
Step 3: Wait for manipulation
Price trades below the open and below the Asian low, ideally into a discount PD array.
Step 4: Confirm
A lower-timeframe MSS with displacement back up.
Step 5: Enter and target
Buy the retrace; stop below the manipulation low; target the day's draw on liquidity.
How Often Does the AMD Shape Appear, and Why?
JustWolves tested the Power of Three on about 520 real trading days (May–November 2026) for EUR/USD, GBP/USD, USD/JPY and gold. We used the ICT day from midnight to 17:00 New York, opened at midnight. AMD shape: on an up day, price first traded below the open and made the day's low before the day's high (the mirror for down days). As a control, we shuffled each day's hourly candles into random order and measured the same things. Shuffling keeps every candle's size but removes any real sequence.
| Measure | Real data | Shuffled (random order) |
|---|---|---|
| Days with the AMD shape (move against the day first, then the real move) | 82% | 84% |
| Days where the open sat in the 20% of the range on the losing side | 51% | 44% |
| Typical move against the day before it turned (median, % of day's range) | 20% | 23% |
The AMD shape appeared on more than four days in five, and just as often in randomly shuffled data. That is not a coincidence. In any random price path, the day's low on an up day often comes before the high and below the open, simply because paths wander before they trend. So the shape's frequency is not evidence of deliberate accumulation or manipulation.
There was one difference worth noting. In real data, the open sat close to the day's losing extreme somewhat more often than chance (51% vs 44%). That fits the practical observation behind PO3: on many days the open ends up near one end of the range, so price spends little time on the wrong side of it. That small tendency, not the story about manipulation, is what a PO3 trader is actually trying to use.
What matters for trading is the part you cannot see in hindsight: your bias. The PO3 filter (buy below the open on a bullish day) only helps if the bias is right more often than not. Our tests of simple bias rules, in Daily and Weekly Bias, found that the obvious ones predicted the next day's direction no better than a coin flip.
Limits of the Model
- Hindsight: every finished daily candle can be described in AMD terms. In real time, a dip may be manipulation or the start of a bearish day.
- Bias is everything: if the daily bias is wrong, the 'manipulation' is the real move and the trade fails.
- Not every day has a clean PO3: range days, news days and gap days often don't.
- The story is interpretive: the pattern is observable; claims about who is accumulating aren't.
Practical Example
Hypothetically, GBP/USD's daily bias is bullish, with buy-side liquidity at 1.2780. In winter, the New York midnight open (10:30 am IST) is 1.2722 and the Asian range is 1.2712–1.2731.
In the London kill zone, price drops to 1.2696, below the open and the Asian low, into a 1-hour bullish FVG. A 5-minute MSS forms at 1:40 pm IST. Ishita buys at 1.2704 with a stop at 1.2688, targeting 1.2780: 16 pips of risk for 76 pips. By New York the day is running up from its low, the distribution phase, if the bias was right.
Common Mistakes
- Labelling AMD after the day closes and believing it was predictable.
- Buying above the open on a bullish day.
- Ignoring the bias, so every dip looks like manipulation.
- Expecting PO3 every day.
- Forgetting daylight saving when marking the midnight open.
Professional Insight
The useful core of PO3 is a well-known observation: on trending days, the open is often near one extreme of the day's range. Traders with a directional view try to buy below the open on up-days and sell above it on down-days. PO3 gives that idea a structure and a vocabulary.
Risk Considerations
- Wrong bias turns 'manipulation' into a trend.
- Manipulation can extend further than expected; size for the stop.
- News can create or destroy the pattern.
Important Terminology
| Term | Meaning |
|---|---|
| Power of Three (PO3) | ICT's three-phase model of a candle's formation. |
| AMD | Accumulation, manipulation, distribution. |
| Manipulation | The move against the day's direction, taking liquidity. |
| Distribution | The main move in the day's direction. |
| New York midnight open | The opening price ICT uses as a daily reference. |
What is Power of Three in ICT?
A model describing a candle as accumulation (range), manipulation (a move against the eventual direction) and distribution (the main move).
What does AMD stand for?
Accumulation, manipulation and distribution, the three phases of the Power of Three.
How do I trade Power of Three?
With a daily bias, wait for price to move against it below (or above) the open, then enter on a lower-timeframe shift back in the bias direction.
What is the New York midnight open?
The price at midnight New York time, used by ICT as a daily reference: about 10:30 am IST in winter, 9:30 am in summer.
Does Power of Three happen every day?
No. Many days, especially ranges and news days, don't show a clean pattern.
How often does the Power of Three pattern happen?
In our test of 520 real trading days, the AMD shape (a move against the day first, then the real move) appeared on 82% of days, and on 84% of days when the same hourly candles were shuffled into random order. Its frequency is what random price paths produce.
Does the midnight open matter in ICT?
In our data, the open sat near the day's losing extreme somewhat more often than chance (51% of days vs 44% in shuffled data), a small real tendency. Using it to enter still depends on knowing the day's direction in advance.
Practical Exercise
Study 20 daily candles.
Your task
Step 1: Mark the open
The New York midnight open for each day.
Step 2: Classify the day
Clean PO3 up, clean PO3 down, or neither.
Step 3: Timing
When did the manipulation extreme form, in IST?
Step 4: Real time
Could you have known the bias before the manipulation? Be honest.
Check Your Understanding
In PO3, manipulation on a bullish day is:
Related Lessons
Previous: The Asian Range and Sessions. Next: The Judas Swing. See also Advanced CISD and AMD.