
The Judas Swing: The False Move Before the Real One
JustWolves is an educational platform and is not a SEBI-registered investment advisor. Trading financial instruments involves significant risk of loss and may not be suitable for all investors. Past performance is not indicative of future results. Read our full disclaimer →
What you'll learn
- The Judas swing is an early-session move against the day's eventual direction
- It usually forms soon after the New York midnight open or in the London kill zone
- It often takes the Asian high or low before reversing
- It's the manipulation phase of Power of Three, given a name
- Trade it only with a daily bias and a lower-timeframe shift back in the bias direction
In this article · 14 sections
The Judas swing is ICT's name for a familiar frustration: the session opens, price moves convincingly one way, traders follow, and then it reverses for the rest of the day. ICT treats that first move as a deliberate false start. This lesson defines the Judas swing, shows where and when it usually appears, and turns it into a rule-based setup.
What You Will Learn
- What the Judas swing is and how it fits Power of Three
- When it typically forms, in IST
- How to recognise it in real time
- A rule-based way to trade it
Before You Start
Read Power of Three (AMD) and Inducement and Fake Breakouts first.
What the Judas Swing Is
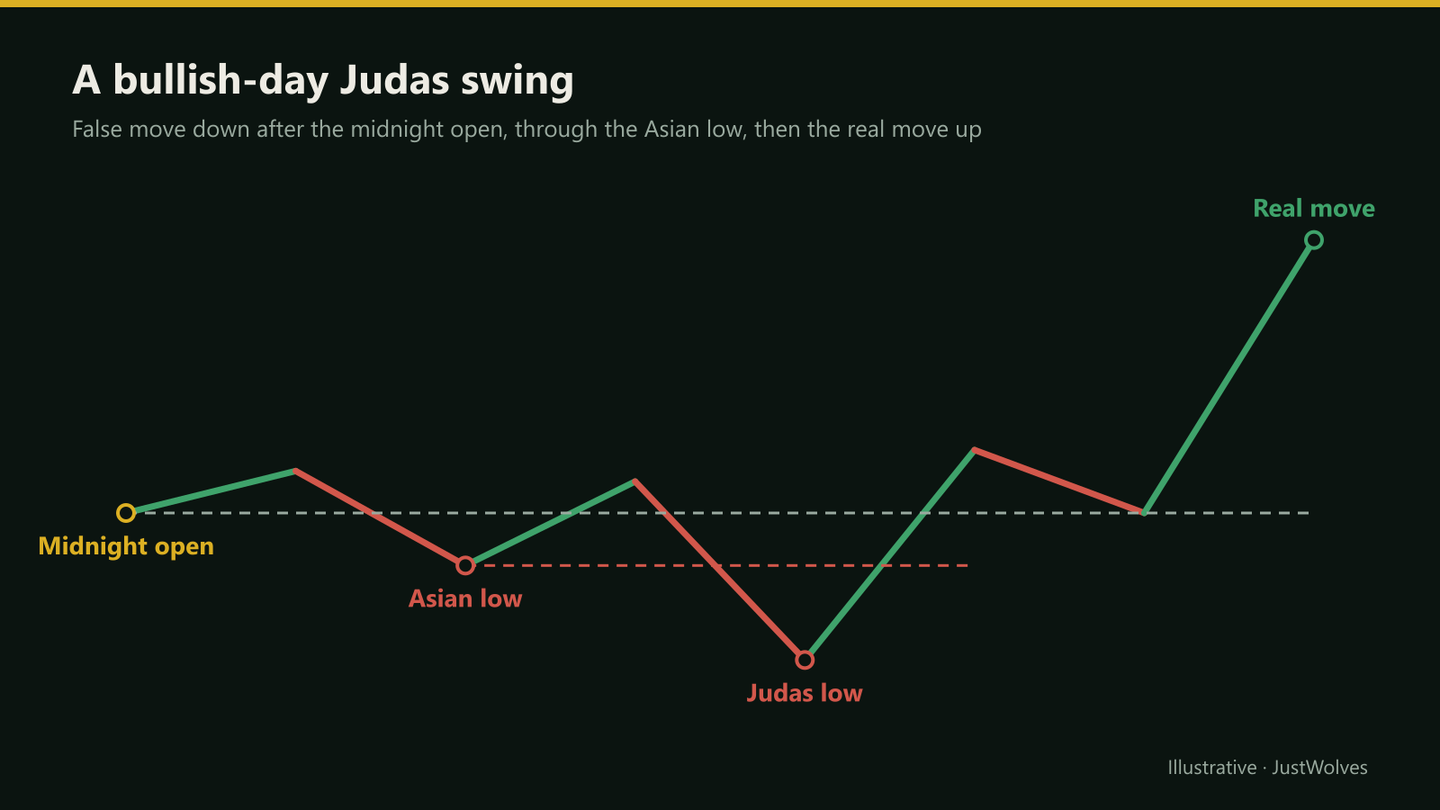
The Judas swing is an early-session move that runs against the day's eventual direction, typically taking an obvious level such as the Asian range high or low, before price reverses. The name refers to a false signal: the move looks like the start of the day's trend but isn't.
In Power of Three terms, it's the manipulation phase. In SMC terms, it's a form of inducement and liquidity sweep at the start of the day.
When It Forms
| Window | New York time | IST (winter / summer) |
|---|---|---|
| After the midnight open | Midnight – 2:00 am | 10:30 am – 12:30 pm / 9:30 – 11:30 am |
| London kill zone | 2:00 – 5:00 am | 12:30 – 3:30 pm / 11:30 am – 2:30 pm |
| New York open (some days) | 7:00 – 10:00 am | 5:30 – 8:30 pm / 4:30 – 7:30 pm |
For traders in India, the London window is the most convenient: the Judas swing, if there is one, often forms in the early afternoon IST.
Recognising It in Real Time
- It moves against your daily bias (lesson 03.02.05). Without a bias, you can't call any move a Judas swing.
- It takes an obvious level: the Asian high or low, the previous day's high or low, or equal highs or lows.
- It moves away from the opening price in the 'wrong' direction: below the open on a bullish day.
- It fails: a wick and close back, or a lower-timeframe MSS back in the bias direction, ideally with displacement.
Step Through a Judas Swing
The chart follows the worked example in this lesson: a bearish bias, a false rally through the Asian high at the London open, a close back below the midnight open, and the real move lower. Step through it slowly, and at each step ask what you would have known at that moment.
A bearish Judas swing, step by step
Step 1 of 5
Bias first, then the midnight open
The daily bias is bearish, targeting the previous week's low at 1.0790. At midnight New York (10:30 am IST in winter), price opens at 1.0855. The Asian high is 1.0866.
- What to observe
- A written bias before London opens.
- Condition
- Without a bias, there is no Judas swing to look for.
Is the Judas Swing More Than Chance?
Because the Judas swing is easy to see in hindsight, JustWolves tested how often it appears and compared that with what pure chance would produce. Data: about 520 trading days of real hourly candles for EUR/USD, GBP/USD, USD/JPY and gold (May–November 2026). Definition: the day's high or low (00:00–17:00 New York) formed between midnight and 05:00, and the day closed on the opposite side of the midnight open. That is the shape of a Judas swing.
Control test: for each day we took the same hourly candles and shuffled their order at random, then measured the same pattern again. Shuffling keeps every candle's size but destroys any real timing or sequence in the day.
| Data | Days with the pattern | Share |
|---|---|---|
| Real hourly candles | 328 | 63% |
| Same candles in random order (control) | 332 | 64% |
The pattern appeared on almost two days out of three, and exactly as often in the randomly shuffled data. In other words, the day's high or low forming early, followed by a close on the other side of the open, is something price paths do naturally, whether or not anyone is engineering a false move. A statistician would expect this: in any random path, the extremes are disproportionately likely to occur near the start or the end of the period.
This does not mean the Judas swing framework is useless. It means two things:
- The pattern's frequency is not evidence of manipulation. Seeing many Judas swings in hindsight proves nothing about intent.
- Any edge must come from what you add before the fact: a bias formed in advance and an entry only after the failure is confirmed. Those are exactly the rules this lesson teaches. They are also what you must test, because the shape alone appears as often as chance predicts.
Step by Step: Trading the Judas Swing
Bullish example
Step 1: Before London
Daily bias bullish; mark the midnight open, Asian high and low, and the draw on liquidity.
Step 2: Watch for the false move
Price drops below the open and takes the Asian low, ideally into a discount PD array.
Step 3: Wait for the failure
A 5- or 15-minute MSS back up with displacement.
Step 4: Enter
On the retrace into the FVG or order block left by the shift.
Step 5: Risk
Stop below the Judas low; target the Asian high, then the daily draw on liquidity.
Practical Example
Hypothetically, in winter, EUR/USD's daily bias is bearish, targeting the previous week's low at 1.0790. The midnight open (10:30 am IST) is 1.0855; the Asian high is 1.0866.
At 1:05 pm IST, price spikes to 1.0874, above the Asian high, then a 15-minute candle closes back at 1.0860 and a 5-minute bearish MSS follows. Karan sells the retrace at 1.0864 with a stop at 1.0879, targeting 1.0790: 15 pips of risk for 74 pips. Had price kept rising and closed above 1.0879, the bias would have been wrong and the stop would have done its job.
Common Mistakes
- Calling every morning move a Judas swing.
- Trading it without a pre-set bias.
- Entering before the failure is confirmed.
- Stops just beyond the Asian level rather than beyond the Judas extreme.
- Ignoring news that can turn a 'false' move into the real one.
Professional Insight
The Judas swing is a dressed-up version of something floor traders have long described: the opening move often fades. What ICT adds is a specific frame (bias, open, Asian range, kill zone) that turns an observation into a checklist. As always, test the checklist rather than the story.
Risk Considerations
- Some 'Judas' moves are the real trend.
- Stops beyond the swing can be wide; size accordingly.
- Spreads widen around the midnight open and session changes.
Important Terminology
| Term | Meaning |
|---|---|
| Judas swing | An early-session move against the day's eventual direction. |
| Midnight open | The price at midnight New York time. |
| Asian range | The Asian session's high and low. |
| Manipulation | The Power of Three phase the Judas swing represents. |
| Daily bias | The direction you expect the day to favour. |
What is the Judas swing in ICT?
An early-session move against the day's eventual direction, often taking the Asian high or low, before price reverses.
When does the Judas swing happen?
Typically after the New York midnight open or during the London kill zone: roughly 10:30 am to 3:30 pm IST in winter.
Is the Judas swing the same as manipulation?
Yes, in Power of Three terms it's the manipulation phase.
How do I trade the Judas swing?
With a pre-set daily bias, wait for the move against it to take an obvious level and fail, then enter on a lower-timeframe shift back in the bias direction.
Can I identify a Judas swing in advance?
Only with a bias set beforehand and confirmation that the move has failed; otherwise it's labelled in hindsight.
How often does a Judas swing happen?
The shape (the day's high or low set before 05:00 New York, then a close on the other side of the midnight open) appeared on 63% of 520 trading days in our test. It appeared just as often (64%) when the same hourly candles were shuffled randomly, so its frequency alone is what chance would produce.
Is the Judas swing a form of market manipulation?
It is often described that way, but its frequency does not show it. In our test, randomly reordered price data produced the pattern just as often as real data. Any trading value comes from a bias set in advance and waiting for confirmation, not from the pattern's frequency.
Practical Exercise
Test your bias plus Judas routine.
Your task
Step 1: Write a bias each morning
For 10 days, before 10:30 am IST.
Step 2: Watch London
Did a move against the bias take the Asian level?
Step 3: Confirm or not
Did a lower-timeframe shift back follow?
Step 4: Score
How often was the bias right, and how often did a Judas setup appear?
Check Your Understanding
The Judas swing moves:
Related Lessons
Previous: Power of Three (AMD). Next: Daily and Weekly Bias. See also Inducement and Fake Breakouts.