
Session Liquidity: Previous-Day, Asian and London Highs and Lows
JustWolves is an educational platform and is not a SEBI-registered investment advisor. Trading financial instruments involves significant risk of loss and may not be suitable for all investors. Past performance is not indicative of future results. Read our full disclaimer →
What you'll learn
- Session liquidity levels are the highs and lows of recent sessions: previous day, Asia and London
- They're obvious, so stops and breakout orders cluster beyond them
- In ICT plans they serve as targets (draws on liquidity) and as sweep points for entries
- A common sequence: London takes an Asian level; New York targets a London or previous-day level
- Mark them at the same times every day so your levels are consistent
In this article · 16 sections
The most useful liquidity levels for an intraday trader are often the simplest: yesterday's high and low, and the highs and lows of today's Asian and London sessions. They're obvious to everyone, which makes them natural targets and natural places for sweeps. This lesson shows how to mark them consistently in IST and how to build them into an ICT session plan.
What You Will Learn
- Which session levels to mark and when
- Why these levels attract price
- How to use them as targets and as sweep points
- A daily session-liquidity routine
Before You Start
Read Daily and Weekly Bias and What Is Liquidity in SMC? first.
The Levels
| Level | Set by | Known by |
|---|---|---|
| Previous day high / low (PDH / PDL) | The prior trading day | Start of the new day (around the midnight open, 10:30 / 9:30 am) |
| Asian high / low | 8 pm – midnight New York | 10:30 am / 9:30 am |
| London high / low | The London session so far | Updated through the afternoon; often defined by 5 am New York (3:30 / 2:30 pm) |
| Previous week high / low | The prior week | Monday morning |
Why They Attract Price
Each of these levels is visible to anyone watching the chart, so stop-losses and breakout orders tend to sit just beyond them (lesson 02.02.01). When price reaches them, those orders trigger. The level is then either taken and held (a breakout) or taken and rejected (a sweep). Either way, these levels are where a lot of the day's decisive action tends to happen.
Using Levels as Targets
With a bias set, the nearest untaken session level in that direction is a natural first target, and the previous day or week level the next. In a bullish bias, for example: Asian high first, then London high, then PDH. Choosing targets this way gives each trade a reason for its exit, and lets you check before entry that there's room for at least 2R.
Which Session Takes the Previous Day's Levels?
If session levels are targets, it helps to know when they tend to be reached. JustWolves measured this on about six months of real hourly candles (May–November 2026) for EUR/USD, GBP/USD, USD/JPY and gold. For each day (17:00 to 17:00 New York), we recorded which session first traded beyond the previous day's high or low.
| Session (New York time) | Hours | Share of days |
|---|---|---|
| Asia, 17:00–02:00 | 9 | 45% |
| London, 02:00–07:00 | 5 | 20% |
| New York, 07:00–12:00 | 5 | 17% |
| Afternoon, 12:00–17:00 | 5 | 4% |
| Not taken at all | – | 14% |
This surprises many ICT students. The most common time for the previous day's high or low to be taken first was Asia, not London or New York. That makes sense when you look at the numbers: Asia comes first and covers nine hours, and the previous day often closed near one of its extremes, leaving little distance to cover.
It changes how these levels should be used. By the time London opens, there is a good chance one side of yesterday's range has already gone. Check that before London and adjust your targets: a level already taken is not a target any more, and the remaining side may be far away.
| Measure | Result |
|---|---|
| New York (07:00–12:00) traded beyond the London (02:00–07:00) high or low | 92% of days |
| London (02:00–05:00) traded beyond at least one side of the Asian range | 87% of days |
When Asia Takes Your Target
Because Asia so often reaches the previous day's level first, the chart below walks through what that does to a plan made the evening before.
When Asia takes the level first: adjusting the plan
Step 1 of 5
The plan at the New York close
The previous day high is 1.2788 and its low 1.2701. The bias is bullish and PDH is the planned target.
- What to observe
- PDH is only a few pips away.
- Condition
- Plan: buy dips toward PDH.
The London session's own high or low was almost always revisited or exceeded by New York, which supports using London's extremes as New York targets. But because it happens on nine days out of ten, reaching a London high is not a signal in itself. It is close to the default.
Using Levels as Sweep Points
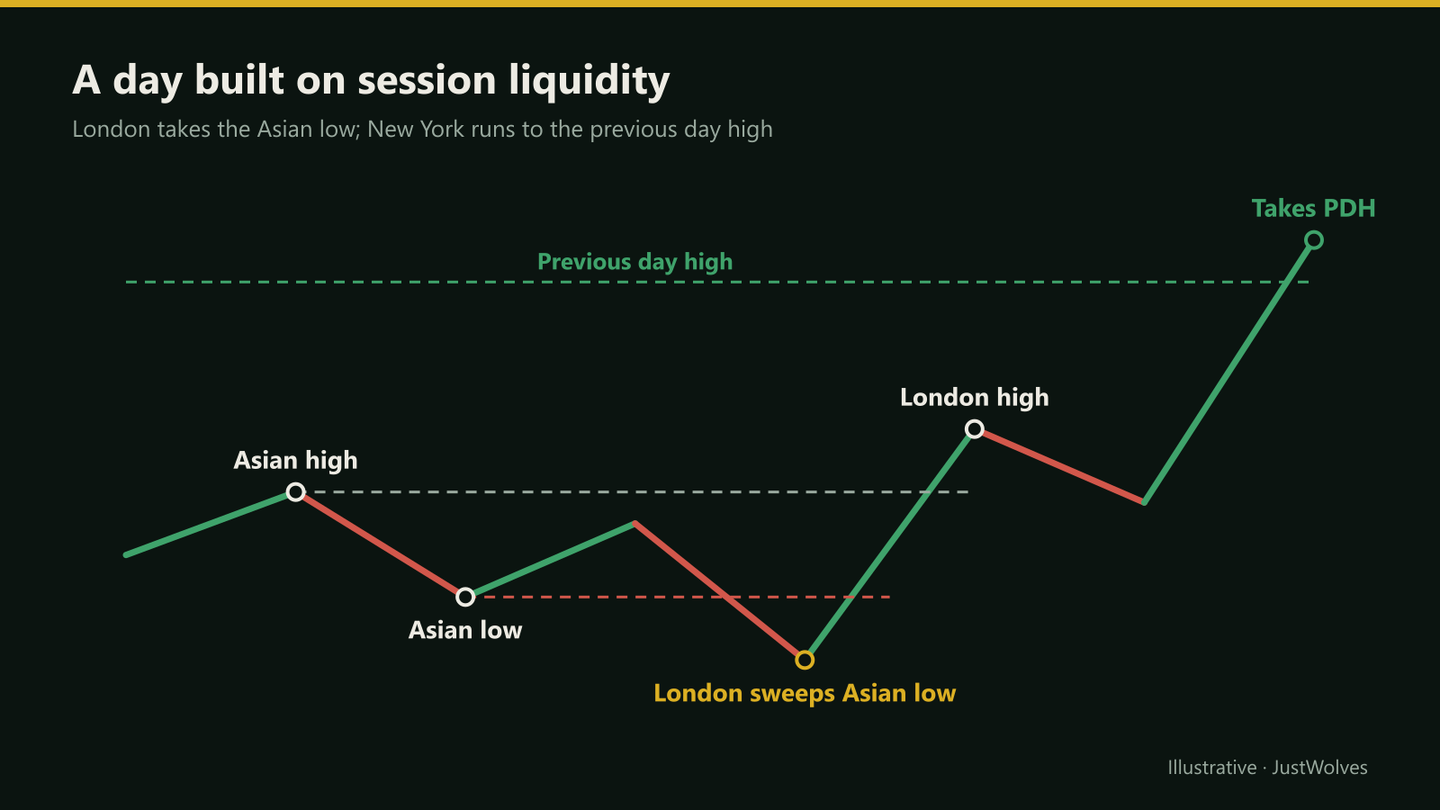
On the other side, the levels against your bias are where you look for entries: a sweep of the Asian low (or PDL) in a bullish bias, followed by a lower-timeframe MSS, is the core of the Judas swing and many kill zone setups.
A Common Daily Sequence
- Asia forms the range.
- London takes one side of the Asian range, often against the daily bias (a sweep), then moves with the bias.
- New York extends towards the London high or low and the previous day's level in the bias direction, or reverses if those levels are reached and rejected.
Track how often this sequence actually occurs on your pair; some weeks it's common, others rare.
Step by Step: A Daily Routine
In IST
Step 1: Morning (after the midnight open)
Mark PDH, PDL, PWH, PWL and the midnight open.
Step 2: After the Asian session
Mark the Asian high and low.
Step 3: Set the bias
Choose the draw on liquidity and the sweep side.
Step 4: London kill zone
Watch the sweep side for a sweep and MSS; target the Asian opposite side and beyond.
Step 5: Before New York
Mark the London high and low; plan continuation or reversal around them and the PDH/PDL.
Practical Example
Hypothetically, in winter, GBP/USD's PDH is 1.2788 and PDL 1.2701. The Asian range (6:30–10:30 am IST) is 1.2730–1.2749. The bias is bullish, targeting the PDH.
At 1:20 pm IST, London takes the Asian low to 1.2724 and a 5-minute MSS forms. Farah buys at 1.2731 with a stop at 1.2718, targeting the Asian high at 1.2749 for a partial and the PDH at 1.2788 for the rest. London tops out at 1.2766; in the New York session, price reaches 1.2789, just above the PDH.
Practise Marking Session Levels
Use the chart below to build the routine from this lesson on real data. Switch to the 1H view, pick a day, and mark the previous day's high and low, the Asian range (20:00–00:00 New York) and the London range (02:00–05:00). Then step forward and record which levels were taken, and by which session.
Session levels practice: GBP/USD
Loading historical candles…
Common Mistakes
- Marking levels at different times each day.
- Placing stops just beyond the levels you expect to be swept.
- Targeting levels already taken today.
- Ignoring the previous week's high and low.
- Assuming the sequence happens every day.
Professional Insight
Many professional intraday traders, ICT followers or not, plan around exactly these levels: yesterday's high and low, the overnight range and the opening range. They're popular because they're objective and widely watched, which makes them some of the most testable reference points you can use.
Risk Considerations
- Levels break cleanly on trend days.
- Several levels close together can produce choppy price action.
- News releases can sweep multiple levels in seconds.
Important Terminology
| Term | Meaning |
|---|---|
| Session liquidity | Resting orders beyond recent session highs and lows. |
| PDH / PDL | Previous day high / low. |
| Asian high / low | The extremes of the Asian session range. |
| London high / low | The extremes of the London session. |
| Sweep point | A level against your bias where you look for a sweep and entry. |
What is session liquidity in ICT?
The resting orders beyond recent session highs and lows, such as the previous day's, the Asian session's and London's.
What are PDH and PDL?
The previous day's high and low, among the most widely watched intraday levels.
How are session levels used?
As targets in the direction of your bias, and as sweep points for entries against it.
When is the Asian range set in IST?
By about 10:30 am IST in northern winter, or 9:30 am in summer, if you use the 8 pm–midnight New York definition.
Does London always take the Asian high or low?
No. It's common but not constant; track it on your own pairs.
Which session usually takes the previous day's high or low?
In our study of real hourly data on four markets, the previous day's high or low was most often first taken during Asia (45% of days), followed by London (20%) and New York (17%). On 14% of days neither was taken.
Does New York usually take the London high or low?
Yes. In our data, New York (07:00–12:00 New York time) traded beyond the London session high or low on 92% of days, so London's extremes are reasonable New York targets, but reaching them is not a signal by itself.
Practical Exercise
Build a session-liquidity log.
Your task
Step 1: Mark the levels daily
PDH, PDL, Asian high/low, London high/low for 20 days.
Step 2: Record which were taken
And in which session.
Step 3: Record the reaction
Sweep and reverse, or break and run.
Step 4: Summarise
Which level was taken most often, and by which session?
Check Your Understanding
Which is a session liquidity level?
Related Lessons
Previous: Daily and Weekly Bias. Next module: ICT Models, starting with Change in State of Delivery (CISD). See also What Is Liquidity in SMC?.