
How to Backtest ICT Setups Without Fooling Yourself
JustWolves is an educational platform and is not a SEBI-registered investment advisor. Trading financial instruments involves significant risk of loss and may not be suitable for all investors. Past performance is not indicative of future results. Read our full disclaimer →
What you'll learn
- ICT setups are easy to see in hindsight, which makes honest backtesting essential
- Write every rule precisely before you start: bias, window, sweep, trigger, entry, stop, target
- Replay charts candle by candle and record every valid setup, including unfilled and losing ones
- Include spread and slippage; low-timeframe ICT models are very sensitive to costs
- Judge by expectancy in R over a meaningful sample, then forward test
In this article · 15 sections
ICT setups look obvious on finished charts: the sweep, the shift, the gap, the clean run to the target. That's exactly why backtesting them is hard. Hindsight makes every winning setup look textbook and every loser look like it 'wasn't valid'. This lesson gives you a method for testing any ICT model honestly, so the results you get are ones you can rely on.
What You Will Learn
- How to turn an ICT model into testable rules
- How to replay charts without hindsight
- What to record for every setup
- How to read the results and what to do next
Before You Start
Step 1: Write Exact Rules
Every subjective word needs a definition. For a Silver Bullet backtest, for example:
| Concept | Testable rule (example) |
|---|---|
| Bias | Daily close above the prior day's high = bullish; below the low = bearish; otherwise neutral, no trade |
| Window | New York AM window, 10:00–11:00 am New York time, converted to IST for each date |
| Sweep | Price trades beyond the London high or low inside or before the window |
| Displacement | A 5-minute candle with a body at least twice the average of the previous ten |
| Entry | Limit at the 50% level of the first FVG after the displacement |
| Stop / target | Stop 2 pips beyond the sweep extreme; target the PDH/PDL, minimum 2R |
Your rules may differ; what matters is that two people applying them would mark the same trades.
Step 2: Replay Without Hindsight
- Use bar replay (available in most charting platforms) to step forward one candle at a time.
- Hide the future: never scroll right of the current candle before making a decision.
- Decide at the time: mark bias before the session, the setup when it forms, and the order before it fills.
- Convert times correctly: check whether US daylight saving applied on each date.
Step 3: Record Everything
| Field | Example |
|---|---|
| Date, time (IST), window | 14 Jan, 8:42 pm, NY AM |
| Bias and reason | Bullish: closed above PDH |
| Setup valid? | Yes: sweep, displacement, FVG |
| Filled? | Yes / No |
| Entry, stop, target | 1.0869 / 1.0852 / 1.0912 |
| Result in R (after costs) | +2.4R / −1R / 0 (unfilled) |
| Notes and screenshot | News at 7:00 pm IST |
A Rule You Need Before You Start
Every backtest eventually meets a candle that touches both the stop and the target. Step through the chart below to see why it needs a rule decided in advance.
The candle that hits both stop and target
Step 1 of 5
A normal trade
Long at 1.0855, stop 1.0840 (15 pips), target 1.0885 (2R).
- What to observe
- A plan with fixed levels.
- Condition
- Log it before the result is known.
Step 4: Include Costs
Low-timeframe ICT models often have stops of 10–20 pips, so a 1-pip spread plus slippage is a significant share of risk. Add realistic costs to every trade, as in Forex Trading Costs. Lesson 03.04.02 shows how much tight stops raise the win rate you need.
Step 5: Read the Results
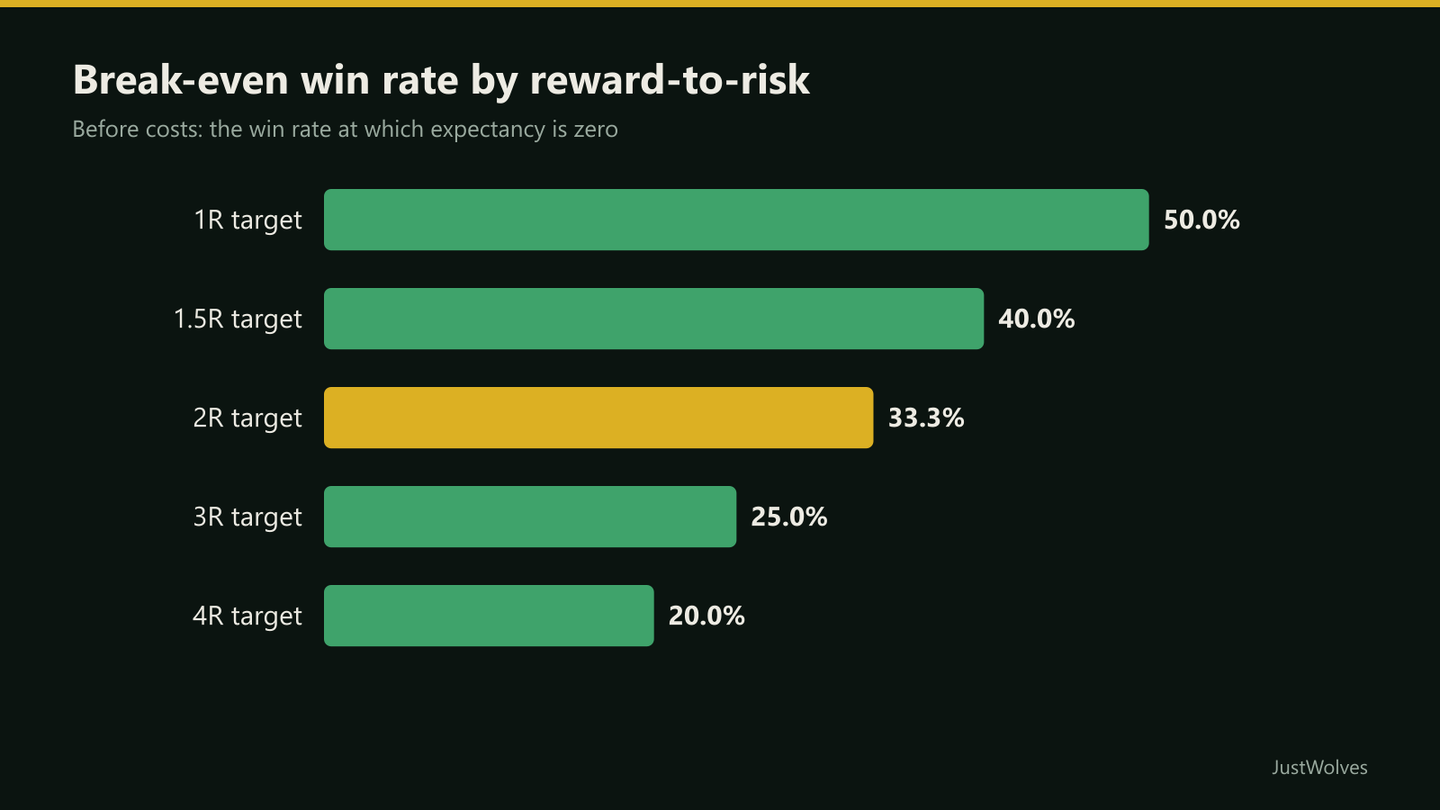
Calculate win rate, average win in R and expectancy, plus maximum drawdown and the longest losing streak. Compare the win rate with the break-even rate for your reward-to-risk:
- Sample size: at least 50 trades, ideally over 100, across different market conditions.
- Consistency: split results by month; one great month shouldn't carry the whole test.
- Then forward test: run the same rules on demo or small size for several weeks and compare.
How Many Trades Do You Need?
"At least 50 trades" is common advice, but it is the bare minimum, not the point at which a result becomes reliable. The table shows the margin of error (95% range) around the average result for two typical ICT-style systems, as the number of trades grows.
| Trades | 2R target, 40% wins (true average +0.20R) | 1R target, 55% wins (true average +0.10R) |
|---|---|---|
| 30 | ±0.53R | ±0.36R |
| 50 | ±0.41R | ±0.28R |
| 100 | ±0.29R | ±0.20R |
| 300 | ±0.17R | ±0.11R |
| 1,000 | ±0.09R | ±0.06R |
Read the first row carefully. After 30 trades, a system whose real edge is +0.20R per trade could show anything from about −0.33R to +0.73R. That is why a great month, or a terrible one, tells you very little. Below about 100 trades, a backtest can tell you that a method is clearly broken, but rarely that it clearly works.
What We Learned Testing ICT Ourselves
While building this course, JustWolves tested many ICT ideas on real market data. A few lessons from that work apply to any ICT backtest:
- Test the sequence, not the pieces. Single ingredients, such as a sweep alone, a CISD alone or a Silver Bullet time window alone, were close to break-even or negative. The full 2022 model sequence was the only model to come out positive on average.
- Always run a control. Several famous ICT patterns, including the Judas swing and Power of Three day shapes, appeared just as often when we shuffled each day's candles into random order. If a pattern appears as often in random data, its frequency proves nothing.
- Check every bug before believing a result. In our own scripts we found and fixed errors that made results look better or worse than they were, including a partial-exit rule that placed the target at the stop on short trades. A result that surprises you deserves a second look at the code or the spreadsheet.
- Report the misses. Limit-order models often fill only half the time. Results per setup, with misses as zero, are what matter.
Practical Example
Pranav backtests a Silver Bullet rule set on EUR/USD over six months of New York AM windows. He finds 74 valid setups, of which 60 filled. After a 1.2-pip cost per trade, 23 of the 60 won, a 38% win rate, with an average win of 2.4R.
His expectancy is (0.38 × 2.4) − (0.62 × 1) ≈ +0.29R per filled trade, or about +17.5R over the 60 trades, with a longest losing streak of seven. These are his test results on his rules, not a general statistic. He moves to a six-week forward test at 0.5% risk before deciding anything.
Common Mistakes
- Vague rules applied differently each time.
- Scrolling ahead before deciding.
- Excluding losers as 'not valid' after the fact.
- Ignoring costs.
- Tiny samples of a dozen trades.
Professional Insight
Professional researchers assume their first good-looking result is overfitted until proven otherwise. A simple defence: split your data, build the rules on the first half, and test them untouched on the second. If the edge vanishes, it probably wasn't real.
Risk Considerations
- Overfitting rules to past charts.
- Changing conditions: a model that worked last year may not this year.
- Execution differs from replay: real fills, slippage and emotions.
Important Terminology
| Term | Meaning |
|---|---|
| Bar replay | A platform feature that reveals candles one at a time. |
| Hindsight bias | Judging past setups with knowledge of their outcome. |
| Expectancy | Average result per trade, in R. |
| Overfitting | Rules tuned so closely to past data that they fail on new data. |
| Forward test | Running rules in real time on demo or small size. |
How do I backtest ICT concepts?
Write exact rules for each step, replay charts candle by candle without looking ahead, record every valid setup with costs, and calculate expectancy in R.
How many trades do I need to backtest an ICT strategy?
At least 100 to rule out a clearly broken method, and several hundred to judge a small edge. For a typical 2R system winning 40% of the time, the margin of error is about ±0.41R per trade after 50 trades and ±0.17R after 300.
What tool can I use for ICT backtesting?
Any charting platform with bar replay, plus a spreadsheet to log trades.
Why do my live ICT results differ from my backtest?
Common reasons are hindsight in the backtest, missing costs, different execution and changing market conditions.
What win rate do I need?
It depends on reward-to-risk: about 33% for 2R and 25% for 3R before costs, higher once costs are included.
What should I do when a candle hits both my stop and target?
Decide in advance. Either check a lower timeframe to see which came first, or count it as a loss. Counting it as a win inflates results, especially around session opens and news.
Should I backtest ICT setups manually or with code?
Manual replay is a good way to learn a model and spot problems in its rules. Code is better for testing many trades without bias once the rules are exact. Many traders start with manual replay, then write down the rules precisely enough that a script or another person could apply them.
Practical Exercise
Run a 20-session pilot.
Your task
Step 1: Write rules
For one ICT model, using the table as a template.
Step 2: Replay 20 sessions
Candle by candle, deciding before outcomes.
Step 3: Log everything
Including unfilled orders and skipped days.
Step 4: Review the rules
Where were you unsure? Tighten those definitions before a full test.
Check Your Understanding
Why is backtesting ICT especially prone to bias?
Related Lessons
Previous module: A Multi-Timeframe ICT Entry and Exit Framework. Next: Common ICT Mistakes and Failed Setups. See also Strategy Evaluation.