
Turtle Soup: Trading False Breakouts of Old Highs and Lows
JustWolves is an educational platform and is not a SEBI-registered investment advisor. Trading financial instruments involves significant risk of loss and may not be suitable for all investors. Past performance is not indicative of future results. Read our full disclaimer →
What you'll learn
- Turtle Soup fades a breakout of an old high or low that fails to hold
- The name comes from a 1990s setup that faded failed 20-day breakouts, the signal used by the 'Turtle' traders
- ICT uses the name for sweeps of old highs and lows followed by a reversal
- Enter after price closes back inside the old level; stop beyond the false-break extreme
- It works best at significant levels, with a bias pointing the other way
In this article · 16 sections
Turtle Soup is one of the few ICT setups with a history outside ICT. The name refers to a strategy for fading failed breakouts of recent highs and lows: the breakouts that a famous group of trend-followers traded. ICT adopted the name for a familiar pattern: an old high or low is taken, the break fails, and price reverses. This lesson covers the origin, the rules, and the filters that separate a good Turtle Soup from a breakout you shouldn't fade.
What You Will Learn
- Where the Turtle Soup name comes from
- How ICT applies it to old highs and lows
- Entry, stop and target rules
- Filters that improve the setup
Before You Start
Read The ICT Silver Bullet and Inducement and Fake Breakouts first.
Where the Name Comes From
In the 1980s, a group of trainee traders known as the 'Turtles' were taught a trend-following system that bought breakouts above 20-day highs and sold breakdowns below 20-day lows. Traders later developed a counter-strategy called Turtle Soup: when price broke a 20-day high or low and then failed, fade the breakout.
ICT uses the name more loosely, for any sweep of an old high or low that fails and reverses. The core idea is the same in both versions: obvious breakout levels attract orders, and a breakout that can't hold often reverses.
The ICT Version
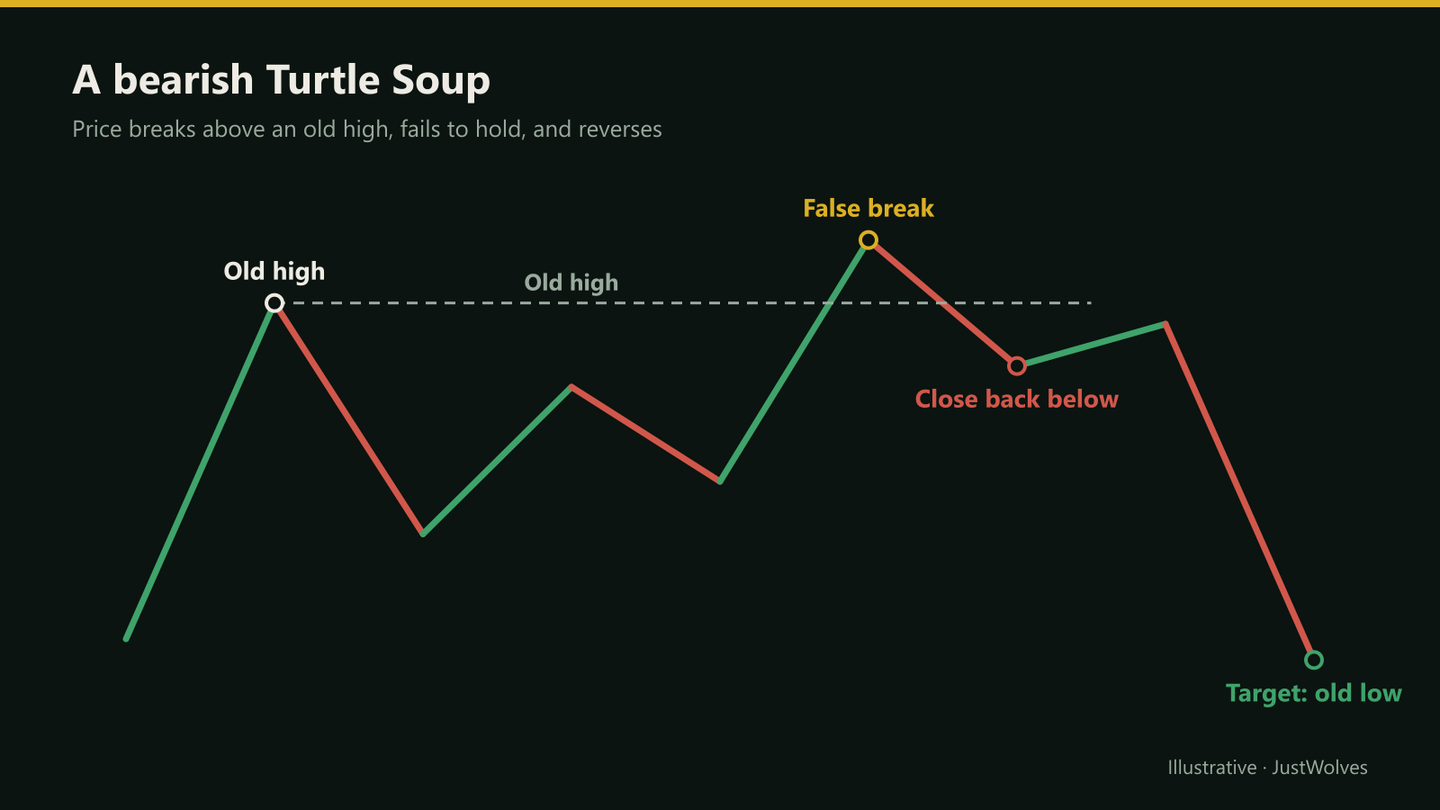
- Level: an old high or low that's obvious: a previous day or week extreme, an intermediate-term high or low, equal highs or lows.
- False break: price trades beyond the level, triggering stops and breakout orders.
- Failure: price closes back on the original side, ideally quickly and with displacement.
- Reversal: price moves towards the opposite liquidity.
Entry, Stop and Target
Bearish example
Step 1: Mark the old high
Choose levels that are clearly significant on your timeframe.
Step 2: Wait for the break and failure
A candle trades above, then closes back below the old high.
Step 3: Confirm
Ideally a lower-timeframe MSS or CISD in the reversal direction.
Step 4: Enter
On the close back below, or on a retest of the old high from below.
Step 5: Risk
Stop above the false-break extreme; target the next sell-side liquidity, such as an old low.
Turtle Soup Step by Step
The chart below follows the worked example in this lesson: a break above the previous week's high that fails and traps the breakout buyers.
A bearish Turtle Soup at the previous week high
Step 1 of 4
An obvious old high
The previous week's high at 1.2810 is a level breakout traders are watching. Price grinds toward it.
- What to observe
- Buy stops and breakout orders above 1.2810.
- Condition
- Bias is bearish; price is in premium.
Filters
- Bias against the breakout: a Turtle Soup short works best when the higher-timeframe bias is bearish or price is in premium.
- Significant level: the more obvious the old high or low, the more meaningful its failure.
- Time: inside a kill zone, rather than in quiet hours.
- Quick failure: the longer price holds beyond the level, the more likely it's a genuine breakout.
- Not into news: a breakout driven by a major release is less likely to fail.
How the Plain Setup Performed
JustWolves tested the basic mechanical version of Turtle Soup on real data for EUR/USD, GBP/USD, USD/JPY and gold: about six months of 1H candles and two years of 4H candles. Rule: a candle trades beyond the highest high (or lowest low) of the previous 20 candles, where that extreme was at least three candles old, and closes back inside it. Entry at the close, stop just beyond the new extreme, target 2R, trades closed after 12 candles. No bias or premium/discount filter was applied. Costs were excluded.
| Timeframe | Setups | Winning trades | Average per trade |
|---|---|---|---|
| 1H (May–Nov 2026) | 351 | 34% | −0.05R |
| 4H (Nov 2024 – Nov 2026) | 375 | 35% | −0.06R |
On its own, the setup was slightly negative before costs on both timeframes, the same result we found for CRT, which is closely related. About a third of failed breakouts went on to reach 2R; the rest stopped out or stalled.
That fits the callout above: in a trend, breaks of old highs are how the trend progresses, and many "failed" breaks are simply pauses. The filters in this lesson (a bias against the breakout, price in premium or discount, a kill-zone sweep of an obvious level) are where any edge would have to come from. Our test of the related ICT 2022 model, which adds a structure shift and a fair value gap after the sweep, was the first ICT model to come out positive on average, which suggests that confirmation after the failure matters.
Turtle Soup Across Timeframes
The original version used daily charts and 20-day extremes, which suits swing traders: fewer signals, wider stops and larger targets. Intraday traders apply the same logic to session levels such as the previous day's high or the London low, using 5- or 15-minute charts for the failure signal. Lower timeframes produce more setups but also more noise; whichever you choose, keep the level definition and the confirmation rule the same every time.
Practical Example
Hypothetically, GBP/USD is in premium of its daily range with a bearish daily bias. The previous week's high is 1.2810. During the London kill zone, price rises to 1.2822, then a 15-minute candle closes at 1.2803, back below the old high, and a 5-minute CISD follows.
Divya sells at 1.2805 with a stop at 1.2830, targeting the previous day low at 1.2745: 25 pips of risk for 60 pips. If price had held above 1.2810 for several 15-minute closes, she would have treated it as a genuine breakout and stood aside.
Waiting One More Candle
A common refinement, often called "plus one", waits a candle longer. Instead of entering on the close of the candle that failed back inside, it waits for the next candle to confirm, for example by trading back through the failure candle's close or by staying inside the old range. The aim is to skip the many failures that are followed immediately by a second push through the level.
The trade-off is the usual one. Waiting gives up some price and some of the fastest moves, in return for filtering out weak signals. Our 2022-model test, which waits for a structure shift and a fair value gap after the sweep, suggests that this kind of confirmation is worth testing.
A Turtle Soup Checklist
Before taking a Turtle Soup trade, check each line:
- Is the level obvious and old: a previous day or week extreme, or a clear multi-day high or low?
- Does your bias point against the breakout?
- Did the breakout candle close back inside the old level?
- Is the stop beyond the new extreme, with a buffer, and the position sized for that distance?
- Is the first target at least 1.5–2 times the risk?
If any answer is no, skip the trade. In our tests, the unfiltered version of the setup was slightly negative, so the checklist is not optional.
Common Mistakes
- Fading breakouts before they fail.
- Using minor highs and lows.
- Ignoring the trend and bias.
- Stops at the old level rather than beyond the false-break extreme.
- Trading news-driven breakouts.
Professional Insight
Turtle Soup is a reminder that most trading ideas are older than their current names. The original Turtle Soup setup and ICT's sweep-and-reverse rest on the same observation about failed breakouts. Because the rules are simple and objective, it's one of the easier setups to test thoroughly.
Risk Considerations
- Second pushes: price can fail, then break again.
- Stops beyond false-break extremes can be wide.
- Trend days produce breakouts that keep going.
Important Terminology
| Term | Meaning |
|---|---|
| Turtle Soup | A setup fading a failed breakout of an old high or low. |
| Turtles | Traders taught a 1980s breakout system using 20-day highs and lows. |
| False break | A move beyond a level that fails to hold. |
| Old high / low | A prior significant extreme. |
| Fade | Trading against a move. |
What is the Turtle Soup strategy?
A setup that fades a breakout of an old high or low after the breakout fails and price closes back on the original side.
Why is it called Turtle Soup?
It was designed to fade the failed 20-day breakouts traded by the 'Turtle' trend-followers. The same idea was later adapted to intraday liquidity sweeps.
How does ICT use Turtle Soup?
For sweeps of old highs or lows that fail and reverse, usually with a bias against the breakout.
Where does the stop go?
Beyond the extreme of the false break, with a buffer.
Should I fade every breakout?
No. Only trade breakouts that have already failed, at significant levels, with a supporting bias.
Does Turtle Soup work?
The plain mechanical version, without bias or location filters, was slightly negative before costs in our tests: −0.05R per trade on 1H data and −0.06R on 4H data across four markets. Filters and confirmation are what the setup relies on.
What is the difference between Turtle Soup and a liquidity sweep?
They describe the same event: price runs beyond an obvious old high or low and fails to hold. Turtle Soup is the name of the original trading setup built on that event; liquidity sweep is the SMC and ICT description of it.
Practical Exercise
Study failed and successful breakouts.
Your task
Step 1: Find 20 breaks
Of previous day highs or lows on 15-minute charts.
Step 2: Classify
Failed within three candles, or held.
Step 3: Context
Bias direction and kill zone for each.
Step 4: Compare
Did context change how often breaks failed in your sample?
Check Your Understanding
Turtle Soup trades:
Related Lessons
Previous: The ICT Silver Bullet. Next: The ICT 2022 Mentorship Model. See also Inducement and Fake Breakouts.