
Dealing Ranges and Premium/Discount Arrays in ICT
JustWolves is an educational platform and is not a SEBI-registered investment advisor. Trading financial instruments involves significant risk of loss and may not be suitable for all investors. Past performance is not indicative of future results. Read our full disclaimer →
What you'll learn
- A dealing range runs between a significant swing high and swing low that price is currently trading within
- Equilibrium is its midpoint; PD arrays above it are premium arrays, below it discount arrays
- In a bullish bias, look for discount arrays to buy from; in a bearish bias, premium arrays to sell from
- Choose the range from the timeframe that matches your trade, and redraw it after structure breaks
- ICT's 20-, 40- and 60-day 'IPDA look-backs' are one way to frame higher-timeframe ranges, not a proven law
In this article · 15 sections
Premium and discount appeared in the SMC course as a way of choosing which zones to trade. ICT uses the same idea but organises it around the dealing range: the range price is currently trading inside, and the reference zones (PD arrays) within it. This lesson shows how to identify the right dealing range on each timeframe, how premium and discount arrays are defined, and how ICT frames higher-timeframe ranges.
What You Will Learn
- What a dealing range is and how to draw one
- How premium and discount arrays are defined
- How to choose and update ranges across timeframes
- The IPDA look-back idea and how to use it sensibly
Before You Start
Read ICT Market Structure and Premium, Discount and Equilibrium first.
The Dealing Range
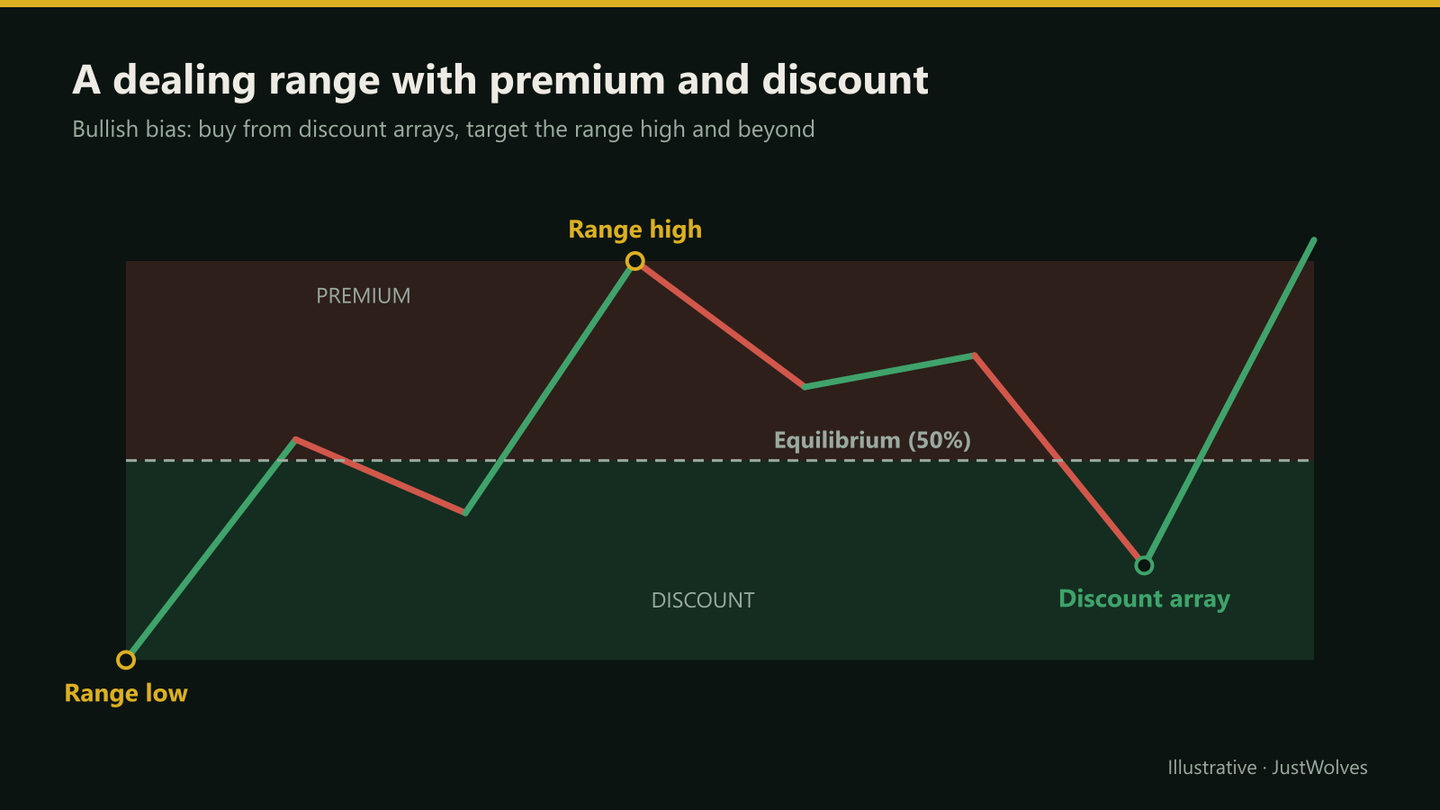
A dealing range is the span between a significant swing high and a significant swing low that price is currently trading between. In ICT terms, it's usually defined by intermediate- or long-term highs and lows (lesson 03.01.02) on your analysis timeframe.
Its midpoint is equilibrium. Above it is premium, below it discount. The range tells you where price is relatively expensive or cheap right now, and where the next liquidity sits: beyond the range high and range low.
Premium and Discount Arrays
A PD array is a reference zone such as an FVG, order block or breaker (lesson 03.01.04). The same zone is a premium array if it sits above equilibrium and a discount array if it sits below.
The rule is simple: in a bullish bias, use discount arrays for entries; in a bearish bias, use premium arrays. A bullish FVG in premium can still matter, for example as a target or a place where price pauses, but it isn't a preferred long entry.
The Dealing Range Step by Step
The chart below draws a bullish dealing range, splits it at equilibrium and walks through a trade taken only from the discount half.
Trading from discount inside a bullish dealing range
Step 1 of 4
Define the dealing range
A bullish leg runs from the intermediate-term low at 1.2610 to the intermediate-term high at 1.2790. That is the dealing range.
- What to observe
- Two significant swings, not minor ones.
- Condition
- Use the range on your trading timeframe.
Choosing the Right Range
- Match the timeframe: a swing trade uses the daily or 4-hour range; an intraday trade uses the 1-hour or 15-minute range.
- Use significant swings: intermediate- or long-term highs and lows, not every wiggle.
- Update after breaks: when price breaks above the range high and holds, the new range runs from the low of that leg to the new high.
- Nest ranges: a 15-minute discount array inside a 4-hour discount range is a stronger location than one in 4-hour premium.
IPDA Look-Back Ranges
ICT material describes 'IPDA data ranges': look-backs of the last 20, 40 and 60 trading days, used to find the highs and lows that frame higher-timeframe dealing ranges and likely draws on liquidity. Some versions also look forward the same number of days.
As a practical tool, this simply means: on the daily chart, note the highest high and lowest low of the last 20, 40 and 60 trading days. Those levels are visible to many traders and often act as targets. The claim that an algorithm specifically uses these windows isn't verifiable; treat them as a convenient, consistent way to frame the bigger picture.
Using the Look-Back Ranges in Practice
The 20, 40 and 60-day look-backs are easiest to use as a simple checklist each week rather than as a theory to believe:
- Mark the highest high and lowest low of the last 20 trading days. These frame the range most short-term traders are watching.
- Do the same for 40 and 60 days. If a 40- or 60-day extreme sits just beyond the 20-day one, the next pool of liquidity is close; if it is far away, a breakout of the 20-day range has more room.
- Note where price is inside the 20-day range. Our data above suggests the deepest part of the discount is the only zone with even a small statistical lean, so a long setup there has location on its side.
Re-mark the levels once a week. Moving them every day turns a stable framework into hindsight.
The Psychology of Waiting for Discount
The hardest part of trading from a dealing range is watching price rally without you because it never reached discount. That feeling pushes traders to buy in premium "just this once", which is the trade the framework exists to prevent. Accept missed trades as the cost of a better average price, and log them, so you can see over time whether waiting for discount is helping in your market.
Step by Step: Building Your Range Map
Before each session
Step 1: Higher timeframe
Mark the 20-, 40- and 60-day highs and lows on the daily chart.
Step 2: Analysis timeframe
Draw the current dealing range between significant swings; mark equilibrium.
Step 3: Bias
From structure: bullish, bearish or neutral.
Step 4: Arrays
List discount arrays (for longs) or premium arrays (for shorts) in the range.
Step 5: Targets
The range extreme in your direction, then the next higher-timeframe level.
Practical Example
Hypothetically, GBP/USD's 4-hour structure is bullish. The current dealing range runs from an ITL at 1.2610 to an ITH at 1.2790, so equilibrium is 1.2700. The 40-day high, at 1.2835, is the next higher-timeframe target.
Two bullish FVGs exist: 1.2735–1.2748 (premium) and 1.2652–1.2668 (discount). Pradeep plans longs only from the discount FVG, targeting first the range high at 1.2790 and then 1.2835. When price later breaks above 1.2790 and holds, he redraws the range.
Does Buying Discount and Selling Premium Help? Our Test
JustWolves measured this on about two years of real 4H candles (EUR/USD, GBP/USD, USD/JPY and gold). For each candle, we placed the close within the high–low range of the previous 30 candles (about five trading days) and recorded where price was six candles (24 hours) later.
| Position in range | Candles | Price higher 24h later | Average move |
|---|---|---|---|
| Deep discount (lowest 25%) | 2,806 | 55% | +0.06 candle ranges |
| Discount (25–50%) | 2,588 | 50% | +0.02 |
| Premium (50–75%) | 2,840 | 51% | +0.10 |
| Deep premium (top 25%) | 3,970 | 51% | +0.04 |
Only one row stands out: closes in the deepest quarter of the range were followed by higher prices 55% of the time, a modest tendency to bounce. Premium did not produce the mirror effect. Price was no more likely to fall from premium than from anywhere else, partly because gold trended strongly upward during the test, and in a trend, premium keeps getting more premium.
The practical reading matches this lesson's main idea, with a caveat. Buying in discount within a bullish range is sensible location: it improves your price and your reward-to-risk. But being in discount is not, by itself, a reason to expect a rise. The direction still has to come from your bias, and in a strong trend, the best entries may never reach discount at all.
Map a dealing range: gold 4H
Loading historical candles…
Common Mistakes
- Using minor swings to define the range.
- Buying premium arrays because they're closer.
- Not redrawing after a break.
- Mixing timeframes: a 5-minute range doesn't tell you about daily premium.
- Treating IPDA windows as exact turning points.
Professional Insight
The dealing range is essentially a way of keeping your trades on the right side of value: buying low in up-moves and selling high in down-moves. Whether you call the levels arrays, zones or support and resistance, using them in the correct half of a well-chosen range is what improves risk–reward.
Risk Considerations
- Strong trends may not pull back into discount before continuing.
- Range choice is subjective; write your rule for which swings count.
- Higher-timeframe levels can be overrun by news.
Important Terminology
| Term | Meaning |
|---|---|
| Dealing range | The span between significant swing extremes that price is trading within. |
| Equilibrium | The 50% level of the dealing range. |
| Premium / discount array | A PD array above / below equilibrium. |
| IPDA data range | ICT's 20-, 40- and 60-day look-back windows. |
| Draw on liquidity | The level price is most likely heading towards next. |
What is a dealing range in ICT?
The span between a significant swing high and swing low that price is currently trading within, split at equilibrium into premium and discount.
What are premium and discount arrays?
PD arrays, such as FVGs and order blocks, located above equilibrium (premium) or below it (discount).
What are IPDA data ranges?
ICT's 20-, 40- and 60-trading-day look-back windows, used to frame higher-timeframe highs, lows and targets.
Which dealing range should I use?
The one on the timeframe that matches your trade, defined by intermediate- or long-term swings.
When do I redraw the dealing range?
After price breaks and holds beyond the range high or low.
Does buying in discount work in ICT?
Partly. In our test of about 12,000 real 4H candles, closes in the lowest quarter of the 5-day range were followed by higher prices 55% of the time over the next 24 hours. The rest of the range, including premium, behaved close to random.
What is equilibrium in a dealing range?
The 50% level between the range high and low. Above it is premium, where ICT traders look to sell in a bearish bias; below it is discount, where they look to buy in a bullish bias.
Practical Exercise
Map ranges on two timeframes.
Your task
Step 1: Daily chart
Mark the 20-, 40- and 60-day highs and lows for one pair.
Step 2: 4-hour chart
Draw the current dealing range and equilibrium.
Step 3: Classify arrays
Label every FVG and OB as premium or discount.
Step 4: Plan
Write which arrays you'd trade, in which direction, and your targets.
Check Your Understanding
Equilibrium is:
Related Lessons
Previous: ICT Market Structure. Next: PD Arrays. See also Premium, Discount and Equilibrium.