
A Multi-Timeframe ICT Entry and Exit Framework
JustWolves is an educational platform and is not a SEBI-registered investment advisor. Trading financial instruments involves significant risk of loss and may not be suitable for all investors. Past performance is not indicative of future results. Read our full disclaimer →
What you'll learn
- A complete framework answers five questions: direction, location, time, trigger and exit
- Direction from weekly and daily bias; location from PD arrays in premium or discount
- Time from kill zones; trigger from a lower-timeframe MSS or CISD
- Exits combine liquidity targets, projections, time stops and a fixed rule for moving the stop
- Writing the framework as a checklist is what makes it testable
In this article · 17 sections
You now have more ICT concepts than any one trade needs. This lesson assembles them into a single framework with a clear job for each piece: what decides direction, where to act, when to act, what triggers the entry, and how the trade ends. The aim isn't a perfect system; it's a written process you can follow the same way every time and then measure.
What You Will Learn
- A five-question framework for every ICT trade
- How the timeframes fit together
- Entry options and when to use each
- A complete exit plan: targets, projections, time and stop management
Before You Start
Read The ICT 2022 Model and SMC Trade Setups first.
Five Questions
| Question | Answered by | Timeframe |
|---|---|---|
| Direction? | Weekly and daily bias, draw on liquidity | Weekly / daily |
| Location? | PD array in premium (shorts) or discount (longs), ideally OTE | 4-hour / 1-hour |
| Time? | Kill zone or Silver Bullet window | Clock (IST) |
| Trigger? | Sweep + MSS or CISD with displacement | 15- to 1-minute |
| Exit? | Liquidity targets, projections, time stop, stop rules | All |
Direction
Start weekly: is the week likely to reach the previous week's high or low? Then daily: structure, the draw on liquidity, and premium or discount (lesson 03.02.05). If weekly and daily disagree, trade smaller or wait. If both are unclear, the day is neutral.
Location
On the 4-hour and 1-hour charts, draw the dealing range and select one or two PD arrays in the correct half: an FVG, order block, breaker or BPR, ideally overlapping the OTE zone. Unmitigated arrays created by a structure-breaking move come first.
Time and Trigger
Only when price is at your PD array inside a kill zone do you drop to the entry timeframe. The trigger is the sequence from lessons 03.03.01–03.03.05: liquidity taken against the bias, then an MSS or CISD with displacement back in the bias direction.
Entry Options
| Entry | Where | Trade-off |
|---|---|---|
| FVG limit | Near edge or 50% of the trigger FVG | Good price; may not fill |
| Order block limit | The OB left by the MSS or CISD | Precise; sometimes missed |
| OTE limit | 62–79% of the trigger leg | Deep entry; fewer fills |
| Confirmation close | After the MSS candle closes | Always fills; worse price |
The Exit Plan
- Initial stop: beyond the sweep extreme, with a buffer. Never widened.
- First target: the nearest internal liquidity, such as the session high or low, or −1 SD. Take a partial if your plan uses them.
- Final target: the draw on liquidity from the bias step, or −2 SD if it lines up with a liquidity level.
- Stop management: one fixed rule, for example to breakeven after the first target, or after price makes a new short-term high beyond entry.
- Time stop: close or reduce the trade if it hasn't progressed by the end of the session, or before major news.
One Entry, Three Exit Plans
Exit rules are where many ICT traders quietly lose their edge. The chart below runs three exit plans on the same entry, so you can see how each one plays out on the same price path.
One entry, three exit plans
Step 1 of 5
The entry
A long at 1.0877 with a stop at 1.0863: 14 pips of risk.
- What to observe
- Same entry and stop for all three plans.
- Condition
- Only the exit differs.
Which Exit Rule Did Best in Our Test?
On the mechanical 2022 model test (about six months of real 1H data, four markets, 173 setups), JustWolves compared four exit rules on identical entries and stops. Costs were excluded.
| Exit rule | Winning trades | Average per trade |
|---|---|---|
| Fixed 1R target | 57% | +0.15R |
| Fixed 2R target | 50% | +0.17R |
| Half at 1R, stop to entry, rest to the draw on liquidity | 54% | +0.06R |
| Full position to the draw on liquidity | 43% | +0.02R |
Simple fixed targets did best, and holding everything for the draw on liquidity did worst. The draw is still useful: it tells you which direction to trade and whether there is room for the trade at all. But as an exit, it asked price to travel further than it usually did. A staged exit sat in between: the partial at 1R helped, while the breakeven stop and the distant final target gave some of it back.
Whatever you choose, the framework's rule stands: decide the exit before entry and do not change it during the trade.
Step by Step: The Daily Process
Written once, used every day
Step 1: Morning (before 10:30 am IST in winter)
Weekly and daily bias, draw on liquidity, news check.
Step 2: Before the kill zone
Dealing range, PD arrays, Asian levels, OTE zone.
Step 3: In the kill zone
Wait for price at your array; drop to the trigger timeframe.
Step 4: On trigger
Place the entry per your rule; size from the stop.
Step 5: Manage and review
Follow the exit plan; journal every trade and every skipped setup.
Practical Example
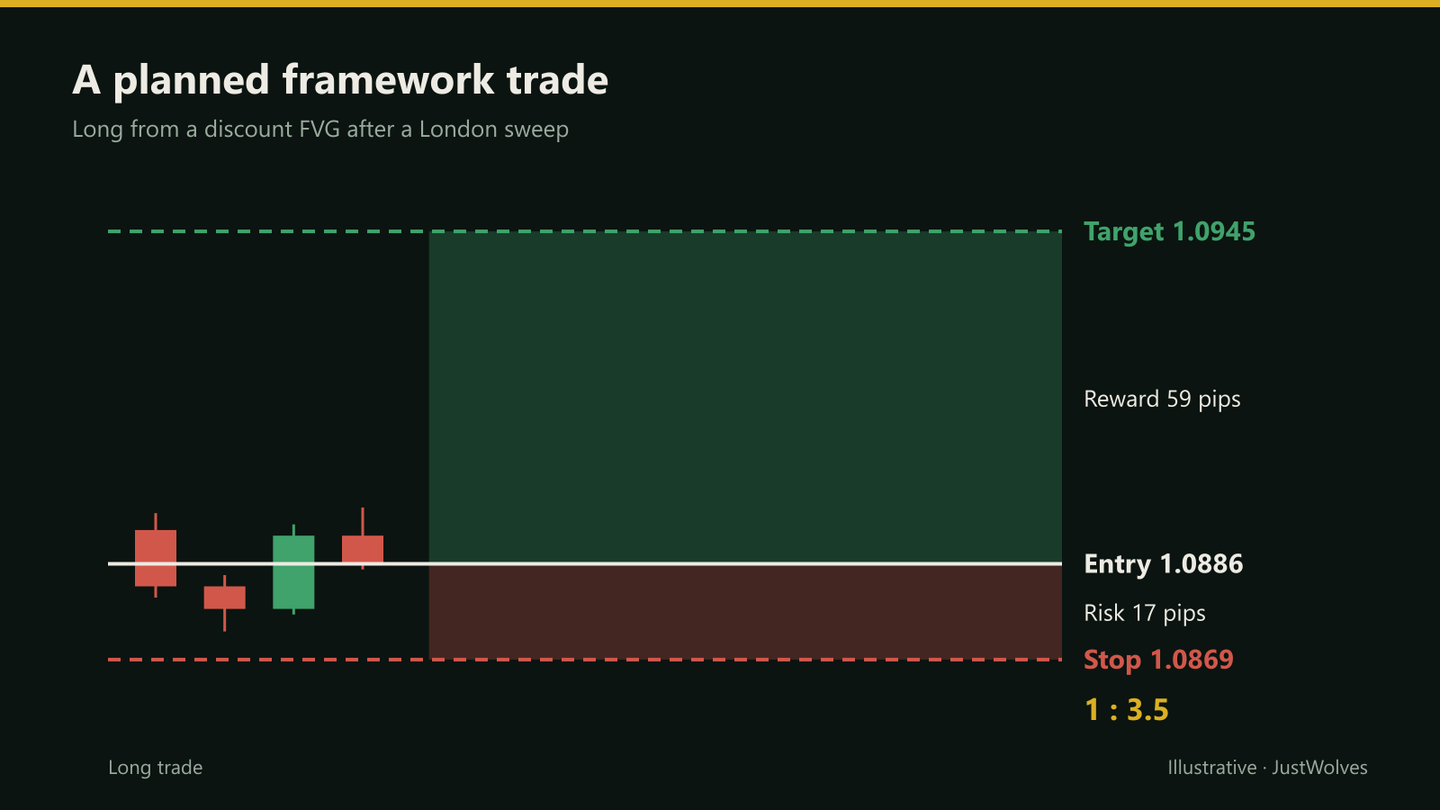
Hypothetically: the weekly bias is bullish (previous week's high untaken), the daily bias is bullish, and equal highs at 1.0945 are the draw. On the 1-hour chart, a discount FVG at 1.0878–1.0890 overlaps the OTE zone of the last leg.
In the London kill zone, price sweeps the Asian low to 1.0874 and a 5-minute MSS leaves an FVG at 1.0882–1.0887. Aditya buys at 1.0886 with a stop at 1.0869. He takes a third at the London high (1.0912), moves the stop to breakeven, and holds the rest for 1.0945, with a time stop at the end of the New York session.
What Our ICT Tests Suggest for the Framework
Across the ICT course, JustWolves tested many of the ideas this framework combines. Read together, the results point to a simple way of weighting the five questions:
- Direction: the hardest question. Simple bias rules predicted the next day no better than chance in our tests (Daily and Weekly Bias), so treat your bias as a hypothesis and track its accuracy.
- Location: useful. Fair value gaps were revisited almost always and held about 60% of the time, and the deepest part of the discount had a small edge.
- Time: useful for attention, not as a signal. Kill zones are the most active hours, but in our tests time windows alone did not improve results.
- Trigger: the sequence matters more than any single trigger. Raw CISDs and sweeps were close to break-even; the full 2022 sequence was the only model with a positive average.
- Exit: simple, pre-planned targets did better than distant ones.
The professional insight below says to delete the filter that does not help. Your own log, built on this framework, is how you find out which one that is.
Common Mistakes
- Using every concept on every trade.
- Changing entry methods from trade to trade.
- No written exit plan.
- Moving the stop to breakeven too early, cutting off valid trades.
- Not journalling skipped setups, which hides the real hit rate.
Professional Insight
Professionals rarely add complexity to improve results; they remove it. Once your framework is written down, the most useful next step is often deleting the filter that contributes least. Your journal will show which one that is.
Risk Considerations
- Over-filtering leaves too few trades to judge.
- Under-filtering brings back noise.
- Partial exits and breakeven rules change expectancy; test them too.
Important Terminology
| Term | Meaning |
|---|---|
| Framework | A written process covering direction, location, time, trigger and exit. |
| Time stop | Exiting a trade that hasn't progressed by a set time. |
| Partial | Closing part of a position at a first target. |
| Breakeven stop | Moving the stop to the entry price. |
| Trigger timeframe | The low timeframe used for the entry signal. |
What is a complete ICT trading strategy?
A written framework covering direction (bias), location (PD arrays), time (kill zones), trigger (sweep plus MSS or CISD) and exits.
Which timeframes should I use for ICT?
Weekly and daily for bias, 4-hour and 1-hour for location, and 1- to 15-minute charts for the trigger.
How do I exit ICT trades?
With a stop beyond the sweep, partials at nearby liquidity, a final target at the draw on liquidity or a projection, and a time stop.
Should I move my stop to breakeven?
It turns some losing trades into scratches but also stops out trades that later reach the target after a normal pullback. In our test, the staged exit with a breakeven stop did worse than a simple fixed target. Whatever you choose, decide it in advance and apply it every time.
How many ICT concepts should I use?
As few as your tested rules need. More filters isn't automatically better.
What is the best exit for ICT trades?
In our test of the mechanical 2022 model, fixed 1R and 2R targets averaged +0.15R and +0.17R per trade, while holding the full position for the draw on liquidity averaged only +0.02R. Samples were small, so test exits on your own setups.
Should I take partial profits on ICT trades?
It is a personal rule, not a requirement. Partial profits reduce the swing in your results but also cut the size of your best trades. Whatever you choose, write it into the plan before the trade and test it, rather than deciding during the trade.
Practical Exercise
Write your framework.
Your task
Step 1: One page
Answer the five questions with exact rules.
Step 2: Choose
One kill zone, one entry method, one stop-management rule.
Step 3: Dry run
Apply it to five past days without hindsight.
Step 4: Simplify
Remove any rule you couldn't apply consistently.
Check Your Understanding
Which question does the kill zone answer?
Related Lessons
Previous: The ICT 2022 Model. Next module: Testing ICT, starting with How to Backtest ICT Setups. See also Building a Professional Trading Plan.