
Change in State of Delivery (CISD): Spotting Early Reversals
JustWolves is an educational platform and is not a SEBI-registered investment advisor. Trading financial instruments involves significant risk of loss and may not be suitable for all investors. Past performance is not indicative of future results. Read our full disclaimer →
What you'll learn
- A CISD is a close back through the opening price of the candle that started the latest one-directional run
- It's an earlier, smaller reversal signal than a CHoCH or MSS
- Earlier means tighter stops, but also more false signals
- Filter CISDs with a higher-timeframe level, a liquidity sweep, displacement with an FVG, and a retest
- Use CISD as a trigger inside a planned setup, not as a standalone signal
In this article · 14 sections
Structure shifts like the CHoCH and MSS wait for price to break a swing point, and by then the reversal is often well underway. ICT's change in state of delivery, or CISD, looks for something earlier: the moment price closes back through the start of the most recent one-way run. This lesson defines CISD precisely, compares it with the structure signals you already know, and sets out the filters that make it usable.
What You Will Learn
- What a CISD is and how to find its origin point
- How CISD compares with CHoCH and MSS
- Four filters that improve CISD setups
- A step-by-step CISD entry
Before You Start
Read Session Liquidity and Market Structure Shift vs CHoCH first.
What a CISD Is
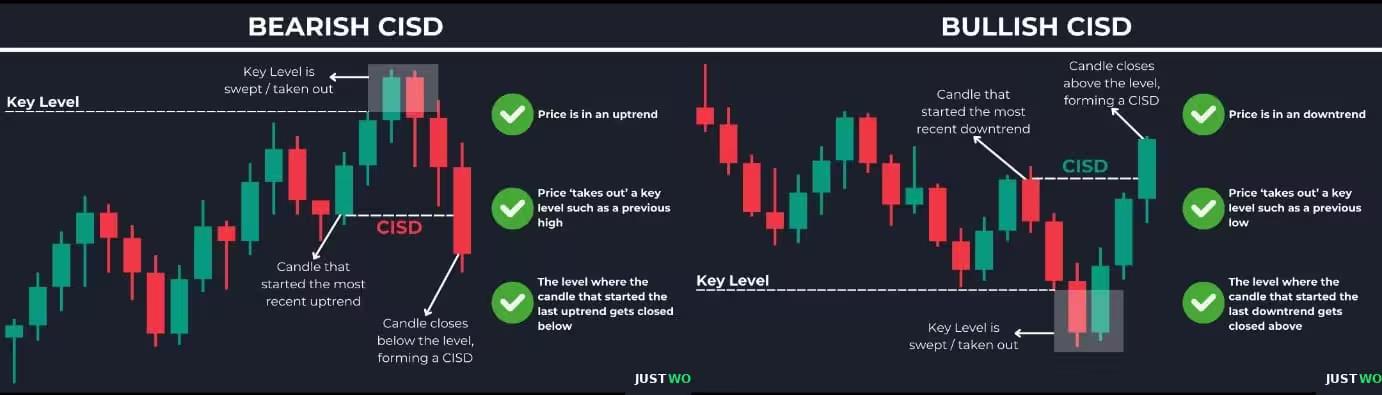
'Delivery' is ICT's word for a run of candles in one direction. A bullish delivery is a series of up-closing candles; a bearish delivery a series of down-closing candles.
The origin point is the opening price of the first candle in the most recent delivery. A CISD happens when a candle closes back beyond that opening price: for a bearish CISD, a close below the open of the first candle of the last up-run; for a bullish CISD, a close above the open of the first candle of the last down-run.
A CISD Step by Step
The chart below follows the bearish example in this lesson: a bullish delivery into a higher-timeframe gap, a sweep, a close back through the origin, and an entry on the pullback.
A bearish CISD at a higher-timeframe level
Step 1 of 5
Bullish delivery into a 4H level
Three up-closing candles carry price into a 4H bearish FVG (1.0905–1.0920). This run of up candles is the bullish delivery.
- What to observe
- A higher-timeframe level above, buy stops above the London high.
- Condition
- Context first: a level and a bias.
CISD vs CHoCH and MSS
| CISD | MSS / CHoCH | |
|---|---|---|
| What breaks | The opening price of the last delivery's first candle | A swing high or low |
| Timing | Earlier | Later |
| Stop size | Usually tighter | Usually wider |
| False signals | More frequent | Less frequent |
| Best use | Trigger inside a planned zone | Confirmation of a structure change |
On a trending chart, CISDs appear constantly. That's why they're only useful with context.
Four Filters
1. A higher-timeframe level
The CISD should form at a 4-hour or daily PD array, such as an FVG, order block or supply/demand zone, or at a key session level. A CISD in the middle of nowhere is just noise.
2. A liquidity sweep first
Better CISDs follow a sweep: price takes an obvious high or low (equal highs, the Asian high, the PDH) and then closes back through the origin. The sweep plus CISD sequence is the core of many ICT setups.
3. Displacement and an FVG
The candle or candles that produce the CISD should be decisive, ideally leaving a fair value gap. A slow drift back through the origin is less convincing.
4. A retest
Rather than entering on the CISD candle, wait for price to pull back towards the origin level or into the FVG it created. That gives a better price and a defined stop.
How Did Raw CISD Signals Perform? Our Test
JustWolves tested a mechanical version of CISD on about six months of real 1H candles (May–November 2026) for EUR/USD, GBP/USD, USD/JPY and gold. Signal: a run of at least two opposite-coloured candles, followed within three candles by a close back through the open of the first candle in that run. We measured where price was 12 hours later, and repeated the test for CISDs whose run had first swept the most extreme high or low of the previous 24 hours.
| Signal | Cases | Price moved in the CISD direction | Average move |
|---|---|---|---|
| Any CISD (no filters) | 849 | 48% | +0.18 candle ranges |
| CISD after sweeping the prior 24-hour extreme | 103 | 42% | −0.09 candle ranges |
| Random direction (for comparison) | – | about 50% | 0 |
Raw CISDs were no better than a coin flip at calling the next 12 hours, which is exactly the warning in this lesson: "On a trending chart, CISDs appear constantly." The positive average with a below-50% hit rate means a few large moves followed some signals, while most did not follow through.
The surprise was the sweep filter. CISDs that followed a sweep of the prior day's extreme did worse in this sample, not better. With only 103 cases, this could be chance, but it is enough to say that "sweep plus CISD" cannot be taken on trust. The other filters in this lesson, a higher-timeframe PD array and entering on a pullback rather than on the CISD candle, were not part of this mechanical test. They are where any real edge would have to come from, and they are what you should measure in your own log.
Step by Step: A Bearish CISD Entry
Checklist
Step 1: Higher-timeframe zone
Price reaches a 4-hour or daily premium array, ideally in a kill zone.
Step 2: Sweep
It takes an obvious high inside or near the zone.
Step 3: Mark the origin
The open of the first candle in the last up-run on your entry timeframe.
Step 4: CISD
A candle closes below that open, ideally leaving a bearish FVG.
Step 5: Enter on the retest
Sell at the origin level or in the FVG; stop above the sweep high; target the next sell-side liquidity.
Practical Example
Hypothetically, EUR/USD reaches a 4-hour bearish FVG at 1.0905–1.0920 during the New York kill zone. On the 15-minute chart, price sweeps the London high at 1.0914 and prints a high of 1.0918. The last up-run started with a candle that opened at 1.0896.
A 15-minute candle closes at 1.0889, below 1.0896: a bearish CISD, leaving an FVG at 1.0894–1.0901. Yusuf sells the retest at 1.0897 with a stop at 1.0922, targeting the Asian low at 1.0850: 25 pips of risk for 47 pips.
Common Mistakes
- Picking the wrong origin candle, often one from an earlier run.
- Trading CISDs without a higher-timeframe level.
- Entering on the CISD candle instead of the retest.
- Using wicks instead of closes.
- Treating every CISD as a trend reversal rather than a trigger.
Professional Insight
CISD is essentially an early-warning version of a structure shift. Traders who use it well treat it like a hair trigger: valuable only when the gun is already pointed in the right direction by bias, location and a sweep. On its own, its sensitivity is a weakness.
Risk Considerations
- Frequent false signals on lower timeframes.
- Tight stops are sensitive to spreads and news.
- Retests don't always come; missed trades are part of the method.
Important Terminology
| Term | Meaning |
|---|---|
| Delivery | A run of candles closing in one direction. |
| Origin point | The opening price of the first candle of the latest delivery. |
| CISD | Change in state of delivery: a close back through the origin point. |
| Retest | Price returning to the origin or FVG after the CISD. |
| Displacement | A decisive, one-sided move. |
What is CISD in ICT?
A change in state of delivery: a candle closing back beyond the opening price of the first candle in the most recent one-directional run.
How is CISD different from CHoCH?
CISD reacts to the origin of the last run, which is earlier and tighter; a CHoCH waits for a swing point to break.
Where do I enter after a CISD?
Usually on a retest of the origin level or the FVG created by the CISD move.
Where does the stop go?
Beyond the sweep extreme that preceded the CISD, with a buffer.
Can I trade every CISD?
No. Without a higher-timeframe level and a liquidity sweep, CISDs produce many false signals.
Is CISD a reliable reversal signal?
Not on its own. In our test of 849 mechanical CISD signals on real 1H data, price moved in the CISD direction over the next 12 hours 48% of the time, no better than chance. It needs higher-timeframe context to be useful.
Does a sweep before CISD make it stronger?
Not in our sample: CISDs after a sweep of the prior 24-hour extreme moved in their direction only 42% of the time (103 cases). The sample is small, so test the filter on your own market.
Which timeframe should I use for CISD?
Use a lower timeframe than the one that defines your bias, for example a 5- or 15-minute CISD inside a 1-hour or 4-hour setup. A CISD on its own timeframe without higher-timeframe context is just one more shift in short-term direction.
Practical Exercise
Practise finding origins.
Your task
Step 1: Find 20 CISDs
On 15-minute charts, marking the origin candle each time.
Step 2: Score the filters
HTF level, sweep, FVG, retest: yes or no.
Step 3: Record outcomes
Did price reach 2R before the stop?
Step 4: Compare
Filtered vs unfiltered CISDs in your sample.
Check Your Understanding
The CISD origin point is:
Related Lessons
Previous module: Session Liquidity. Next: Advanced CISD. See also Market Structure Shift vs CHoCH.