
Optimal Trade Entry (OTE): The 62–79% Retracement Zone
JustWolves is an educational platform and is not a SEBI-registered investment advisor. Trading financial instruments involves significant risk of loss and may not be suitable for all investors. Past performance is not indicative of future results. Read our full disclaimer →
What you'll learn
- OTE is the 62% to 79% retracement of a swing, with 70.5% as the midpoint ICT highlights
- Draw it on the leg that broke structure, from its start to its end
- OTE is strongest when it overlaps a PD array, such as an FVG or order block, in the correct direction
- The stop goes beyond the swing's origin (100%); targets come from liquidity, or from extensions
- Fibonacci levels are reference points, not precise barriers
In this article · 16 sections
The optimal trade entry, or OTE, is ICT's preferred retracement zone: deep enough to offer a good price, but before the point where the move would be invalidated. It's built on Fibonacci retracement levels that many traders already use. This lesson shows how to draw it correctly, why it's combined with PD arrays, and how to plan stops and targets around it.
What You Will Learn
- What the OTE zone is and which levels define it
- How to draw it on the right swing
- How to combine OTE with PD arrays and structure
- Stop and target placement for OTE trades
Before You Start
Read Dealing Ranges and Premium/Discount Arrays and Inversion FVGs first.
The OTE Zone
Draw a Fibonacci retracement over a swing. ICT's optimal trade entry is the area between the 62% and 79% retracement levels, with the 70.5% level as its midpoint. In a bullish swing, that's the part of the discount half that's furthest from the high without reaching the swing low.
Many traders use 61.8% rather than 62%, and 78.6% rather than 79%; the difference is a fraction of a pip on most swings.
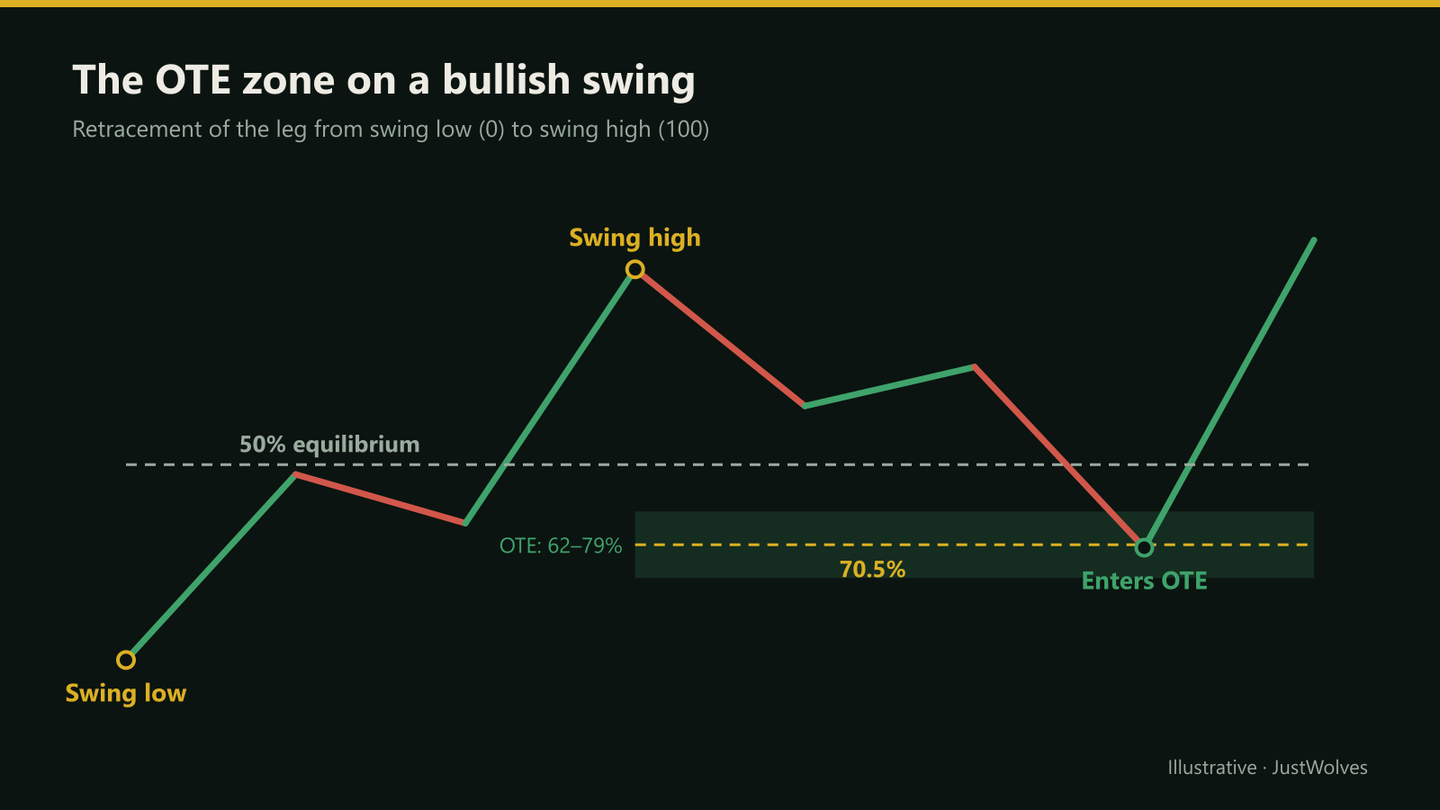
Drawing It on the Right Swing
- Bullish: from the swing low that started the leg (0) to the high that broke structure (100). Retracement levels are measured down from the high.
- Bearish: from the swing high that started the leg to the low that broke structure, measured up from the low.
- Use the leg that broke structure, not a random swing. The break is what gives the leg significance.
- Redraw if price makes a new extreme before retracing.
An OTE Trade on a Chart
The chart below follows the worked example in this lesson: the leg, the levels, the order, the fill and the result.
An OTE long, step by step
Step 1 of 5
An impulse leg breaks structure
AUD/USD rallies from 0.6540 to 0.6620 on the 1-hour chart, breaking above the previous high.
- What to observe
- A clear leg from a swing low to a new swing high.
- Condition
- Draw the retracement on this leg only.
OTE with PD Arrays
On its own, a Fibonacci zone is just arithmetic. ICT combines OTE with a PD array: an FVG, order block or breaker that sits inside the 62–79% zone. The overlap gives a specific area to enter, with two independent reasons behind it.
If no PD array sits in the OTE zone, many traders either wait for a lower-timeframe shift inside the zone or skip the trade.
Stops and Targets
- Stop: beyond the origin of the swing (the 100% retracement, i.e. the swing low in a bullish setup), plus a buffer. If price goes there, the leg has failed.
- First target: the swing high (the 0% level).
- Further targets: the next liquidity, such as an untaken ITH or old high. Some ICT material also uses Fibonacci extensions beyond the swing, such as −27% and −62%, as projection targets.
- Check R: an entry at 70.5% with a stop below 100% and a target at the swing high is roughly 2.4R before the stop buffer and costs; extensions add more.
How Deep Do Pullbacks Go? Our Test
JustWolves tested OTE on about six months of real 1H candles (May–November 2026) for EUR/USD, GBP/USD, USD/JPY and gold. Legs: a move from a swing low to a swing high that broke the previous swing high, at least three average candles long (341 legs, bullish side). We then followed price until it made a new high above the leg or closed below its start, for up to three days.
| Retracement reached | Share of legs |
|---|---|
| 50% | 67% |
| 62% (top of OTE) | 57% |
| 70.5% (OTE midpoint) | 49% |
| 79% (bottom of OTE) | 40% |
| 100% (the leg failed) | 22% |
| Entry level | Filled | Winning trades | Average per filled trade | Average per setup (misses = 0) |
|---|---|---|---|---|
| 50% | 65% | 48% | −0.05R | −0.03R |
| 62% | 56% | 40% | −0.02R | −0.01R |
| 70.5% | 49% | 32% | −0.02R | −0.01R |
| 79% | 41% | 19% | −0.24R | −0.10R |
Three findings matter:
- Many good legs never reach OTE. About four legs in ten resumed without pulling back to 62%. Those are missed trades, and they are often the strongest moves.
- 50%, 62% and 70.5% entries all came out close to break-even. Deeper entries won less often but paid more when they won; the averages barely changed.
- The 79% level was clearly the worst. A pullback that deep was often the start of the leg failing. By the time price reached 79%, more than half of those legs went on to break their starting point.
On its own, then, the Fibonacci zone did not create an edge in this sample, exactly as the callout above suggests: "OTE alone is just a number". Its value is in combination with a PD array and a bias, which is what you should test next. And if price has already retraced beyond about 75%, treat the setup with suspicion rather than as a better price.
Step by Step: An OTE Trade
Bullish example
Step 1: Bias
Higher-timeframe structure bullish.
Step 2: Leg
Identify the leg that broke structure; draw the retracement.
Step 3: Confluence
Find a PD array inside the 62–79% zone.
Step 4: Entry
Limit at the array or 70.5%, or wait for a lower-timeframe MSS inside the zone.
Step 5: Risk
Stop below the swing low; target the swing high, then the next liquidity.
Practical Example
Hypothetically, AUD/USD rallies from 0.6540 to 0.6620 on the 1-hour chart, breaking structure. The OTE zone runs from 0.6570 (62%, rounded) down to 0.6557 (79%), with 70.5% at about 0.6564. A bullish FVG sits at 0.6560–0.6568, inside the zone.
Rohan places a buy limit at 0.6565 with a stop at 0.6535, five pips below the swing low, and a first target at 0.6620. That's 30 pips of risk for 55 pips to the first target, about 1.8R; a second target at the next ITH, 0.6655, takes it to 3R.
The Psychology of the Limit Order
OTE trading means placing an order and walking away, and then often watching price turn just before reaching it. In our data, around four legs in ten resumed without pulling back to 62%. Moving the order up to "catch" the move turns a planned entry into chasing. Decide in advance whether you will ever adjust the order (most OTE traders never do) and keep a count of the trades you missed. That number is part of the strategy's true result.
Common Mistakes
- Drawing the retracement on the wrong leg.
- Treating 70.5% as an exact turning point.
- Entering OTE against the higher-timeframe bias.
- Stops inside the zone instead of beyond the swing origin.
- Using OTE without any PD array or confirmation.
Professional Insight
Fibonacci retracements work partly because so many traders watch them, and partly because deep pullbacks in trends naturally fall in that area. OTE's real benefit is risk–reward: a deep entry with a stop just beyond the swing origin gives a favourable ratio. That benefit remains whether or not the levels have any special meaning.
Risk Considerations
- Strong trends often retrace less than 62%, so OTE entries miss them.
- Deep retracements can become reversals.
- Stops beyond the swing origin can be wide; size accordingly.
Important Terminology
| Term | Meaning |
|---|---|
| Optimal trade entry (OTE) | The 62–79% retracement zone of a swing. |
| Fibonacci retracement | Levels measuring how far price has pulled back within a swing. |
| 70.5% | The midpoint of the OTE zone highlighted in ICT material. |
| Swing origin | The start of the leg; the 100% retracement level. |
| Extension | A projection beyond the swing, such as −27% or −62%. |
What is optimal trade entry in ICT?
The 62% to 79% retracement zone of a swing, used as a preferred entry area, ideally combined with a PD array.
What is the 70.5% level?
The midpoint of the OTE zone that ICT material highlights as a reference entry.
Which swing should I draw the OTE on?
The leg that broke structure, from its origin to its extreme.
Where does the stop go on an OTE trade?
Beyond the swing origin, the 100% level, with a buffer.
Is OTE the same as the golden ratio?
It overlaps it: the 61.8% level is the edge of the OTE zone, which extends to about 79%.
How often does price reach the OTE zone?
In our test of 341 real 1H impulse legs on four markets, about 57% of pullbacks reached the 62% level and 40% reached 79%. About 22% of legs failed completely.
Is the 70.5% OTE entry better than 50%?
Not on its own in our test: entries at 50%, 62% and 70.5% all averaged close to break-even before costs, while 79% entries did clearly worse. OTE needs a PD array and bias to add value.
Practical Exercise
Test OTE on past charts.
Your task
Step 1: Find 20 structure-breaking legs
On 1-hour charts.
Step 2: Draw OTE on each
Mark 62%, 70.5% and 79%.
Step 3: Record
Did price reach OTE? Was a PD array inside it?
Step 4: Outcome
With a stop beyond the origin, did price reach the swing extreme first?
Check Your Understanding
The OTE zone spans roughly:
Related Lessons
Previous: Inversion FVGs and FVG-in-FVG. Next module: Time, Sessions and Bias, starting with ICT Kill Zones. See also Premium, Discount and Equilibrium.