
ICT Market Structure: Short, Intermediate and Long-Term Highs and Lows
JustWolves is an educational platform and is not a SEBI-registered investment advisor. Trading financial instruments involves significant risk of loss and may not be suitable for all investors. Past performance is not indicative of future results. Read our full disclaimer →
What you'll learn
- ICT ranks swing points: short-term (STH/STL), intermediate-term (ITH/ITL) and long-term (LTH/LTL)
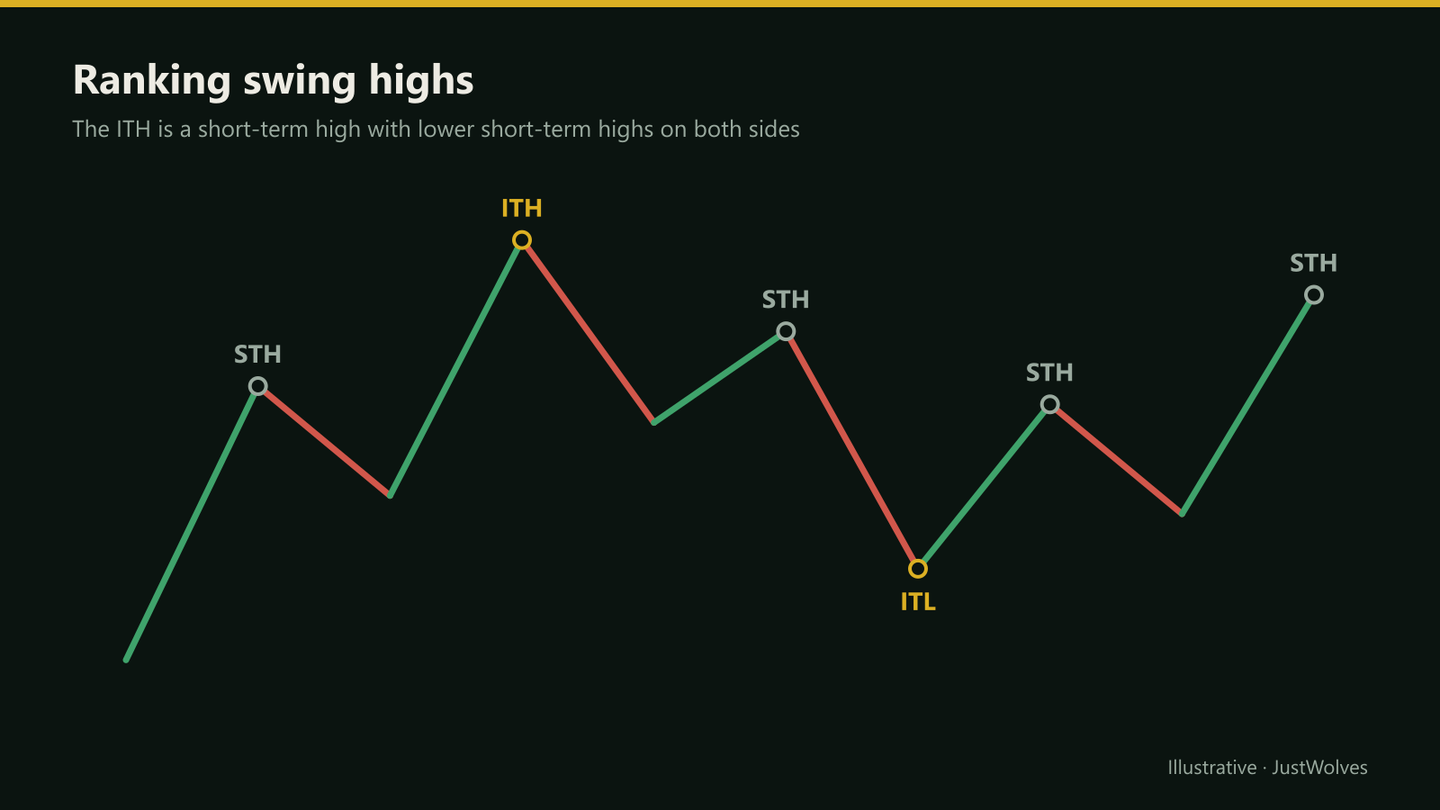
- An intermediate-term high is a short-term high with lower short-term highs on both sides
- A long-term high is an intermediate-term high with lower intermediate-term highs on both sides
- The market structure shift (MSS) is a break of a recent swing with displacement, often after a sweep
- Ranking swings helps you decide which breaks matter, and which highs and lows are meaningful targets
In this article · 16 sections
Market structure in ICT is built on the same swing highs and lows you used in the SMC course. What ICT adds is a simple way of ranking them: short-term, intermediate-term and long-term. That ranking helps you decide which highs and lows actually matter, both as levels to watch for a structure shift and as targets. This lesson recaps the basics and then explains the three-tier system.
What You Will Learn
- A quick recap of SMC structure and the MSS
- How ICT defines short-, intermediate- and long-term swing points
- How to use the tiers for bias, structure shifts and targets
- Common labelling mistakes
Before You Start
Recap: Swings, BOS and MSS
A swing high is a candle high with lower highs either side; a swing low is the reverse (lesson 02.01.02). Bullish structure makes higher highs and higher lows; bearish structure the opposite.
In ICT usage, a market structure shift (MSS) is a break of a recent swing against the prior move, made with displacement and often after a liquidity sweep. SMC traders often call a similar event a change of character; lesson 02.01.06 compares the terms.

Short-Term Highs and Lows
A short-term high (STH) is any swing high: a candle high with a lower high on each side. A short-term low (STL) is any swing low. They're plentiful and mainly useful on your entry timeframe.
Intermediate-Term Highs and Lows
An intermediate-term high (ITH) is a short-term high that has a lower short-term high on each side. In other words, it's the highest of three consecutive short-term highs. An intermediate-term low (ITL) is a short-term low with a higher short-term low on each side.
ITHs and ITLs mark the meaningful turning points within a trend. Breaking an ITL in an uptrend is a more significant event than breaking an ordinary short-term low.
Label the Tiers Step by Step
The chart below labels each tier as it becomes known. Pay particular attention to step 3: an intermediate-term high is only confirmed once a lower short-term high forms after it, several candles later. That delay is the price of a more meaningful level.
Labelling short-term and intermediate-term highs and lows
Step 1 of 5
Short-term highs and lows
A candle high with a lower high on each side is a short-term high (STH); a low with a higher low on each side is a short-term low (STL). Candle 3 is an STH; candles 2 and 4 are STLs.
- What to observe
- Swing points on the entry timeframe.
- Condition
- Label every swing first.
Long-Term Highs and Lows
A long-term high (LTH) is an intermediate-term high with a lower ITH on each side, and a long-term low (LTL) is an ITL with higher ITLs either side. These are the major turning points on the timeframe, often visible as obvious extremes on the next higher timeframe too. They're common targets because many traders watch them. On a daily chart, a long-term high is often a level that has held for weeks.
Using the Tiers
| Tier | Typical use |
|---|---|
| Short-term | Entry-timeframe triggers; small internal targets |
| Intermediate-term | Which break counts as a meaningful structure shift; first targets |
| Long-term | Major targets and draws on liquidity; bias context |
- Bias: in an uptrend, a break below the most recent ITL is a stronger warning than a break of any STL.
- Targets: an unbroken ITH or LTH above price is an obvious buy-side liquidity target.
- Entries: an MSS on the entry timeframe, breaking a short-term swing, is a trigger only if it agrees with the intermediate and long-term picture.
Do Intermediate-Term Breaks Matter More? Our Test
ICT treats a break of an intermediate-term low as a stronger warning than a break of a short-term low. JustWolves tested this on about six months of real 1-hour candles (May–November 2026) for EUR/USD, GBP/USD, USD/JPY and gold. We found every hourly close below the most recently confirmed STL or ITL, then measured where price was 24 hours later, in units of the average hourly range.
| Level broken | Cases | Price lower 24 hours later | Average move |
|---|---|---|---|
| Short-term low (STL) | 896 | 45% | −0.11 hourly ranges |
| Intermediate-term low (ITL) | 327 | 48% | −0.57 hourly ranges |
The answer is a qualified yes. Breaks of intermediate-term lows were followed by average declines about five times larger than breaks of ordinary short-term lows. But the share of cases where price was lower a day later was close to half for both. The difference came from the size of the moves that followed, not from how often price kept falling.
In practice, that means an ITL break is a reason to take risk seriously: tighten management, reduce size, or stop taking trades in the old direction. It is not a reliable signal to reverse your position, because roughly half the time price recovered within a day.
Practise labelling tiers: EUR/USD 1H
Loading historical candles…
Step by Step: Labelling the Tiers
On one timeframe
Step 1: Mark every swing high and low
These are short-term points.
Step 2: Find intermediate points
Short-term highs higher than the short-term highs either side; lows lower than the lows either side.
Step 3: Find long-term points
Intermediate highs higher than the ITHs either side, and the reverse for lows.
Step 4: Read the trend
Are ITHs and ITLs rising or falling?
Step 5: Mark targets
Untaken ITHs/LTHs above, ITLs/LTLs below.
Practical Example
Hypothetically, on the 1-hour EUR/USD chart, Kavita marks short-term highs at 1.0874, 1.0896 and 1.0881. The middle one is higher than both neighbours, so 1.0896 is an ITH. Between them sits an ITL at 1.0848.
Later, a 5-minute MSS breaks a short-term high, suggesting a long. Kavita checks the tiers: the 1-hour ITLs are rising, and the ITH at 1.0896 is untaken above. The MSS agrees with the intermediate picture, so she takes the trade and targets 1.0896.
Long-Term Highs and Lows in Practice
Long-term highs and lows are rare on any single chart, which is exactly what makes them useful. On a 1-hour chart there may be one or two a week. In practice, traders use them in three ways:
- As the edges of the dealing range. The most recent long-term high and low define the range in which premium and discount are measured. See Dealing Range, Premium and Discount Arrays.
- As major targets. A long-term high is usually a level where many stops have built up over days, which makes it a natural destination for a trend leg.
- As the bias line. While price holds above the last long-term low, the larger structure is intact, however many short-term lows break.
Because each tier is confirmed later than the one below it, long-term levels are always known well after they form. Use them for context and targets, and leave timing to the shorter tiers.
Common Mistakes
- Treating every swing as equally important.
- Calling a trend change on a short-term break alone.
- Labelling tiers across different timeframes at once.
- Re-labelling in hindsight with later candles.
- Ignoring untaken ITHs/ITLs when setting targets.
Professional Insight
The three-tier ranking is a neat solution to a real problem in structure analysis: deciding which swings matter. Because the rule is mechanical, it's also easy to code or to apply consistently by hand, which makes it one of the more testable parts of ICT.
Risk Considerations
- Tiers confirm late: an ITH is only known once the next STH forms.
- Ranges produce many conflicting tiers.
- News spikes can create misleading extremes.
Important Terminology
| Term | Meaning |
|---|---|
| STH / STL | Short-term high / low: any swing high or low. |
| ITH / ITL | Intermediate-term high / low: a short-term point more extreme than its neighbours. |
| LTH / LTL | Long-term high / low: an intermediate point more extreme than its neighbours. |
| MSS | Market structure shift: a break of recent structure with displacement. |
| Displacement | A strong, one-sided move. |
What is an intermediate-term high in ICT?
A short-term high that has a lower short-term high on each side.
What is a long-term high in ICT?
An intermediate-term high with a lower intermediate-term high on each side.
What is a market structure shift in ICT?
A break of a recent swing against the prior move, made with displacement and often after a liquidity sweep.
Why rank highs and lows?
To decide which breaks signal meaningful structure changes and which levels make sensible targets.
Is ICT market structure different from SMC?
The basics are the same; ICT adds the short-, intermediate- and long-term ranking.
Is breaking an intermediate-term low a strong signal?
In our test on real 1-hour data, closes below an intermediate-term low were followed by larger average declines than closes below short-term lows, but price was lower 24 hours later only about half the time in both cases. Treat it as a warning, not a reversal signal.
Practical Exercise
Rank swing points on one chart.
Your task
Step 1: Choose a 1-hour chart
Covering two weeks.
Step 2: Mark all STHs and STLs
Then find the ITHs and ITLs.
Step 3: Find any LTH or LTL
Using the same rule one level up.
Step 4: Check behaviour
Were untaken ITHs and ITLs later reached?
Check Your Understanding
An ITH is:
Related Lessons
Previous: Introduction to ICT Trading Concepts. Next: Dealing Ranges, Premium and Discount Arrays. See also BOS vs CHoCH.